Types of Doji candles
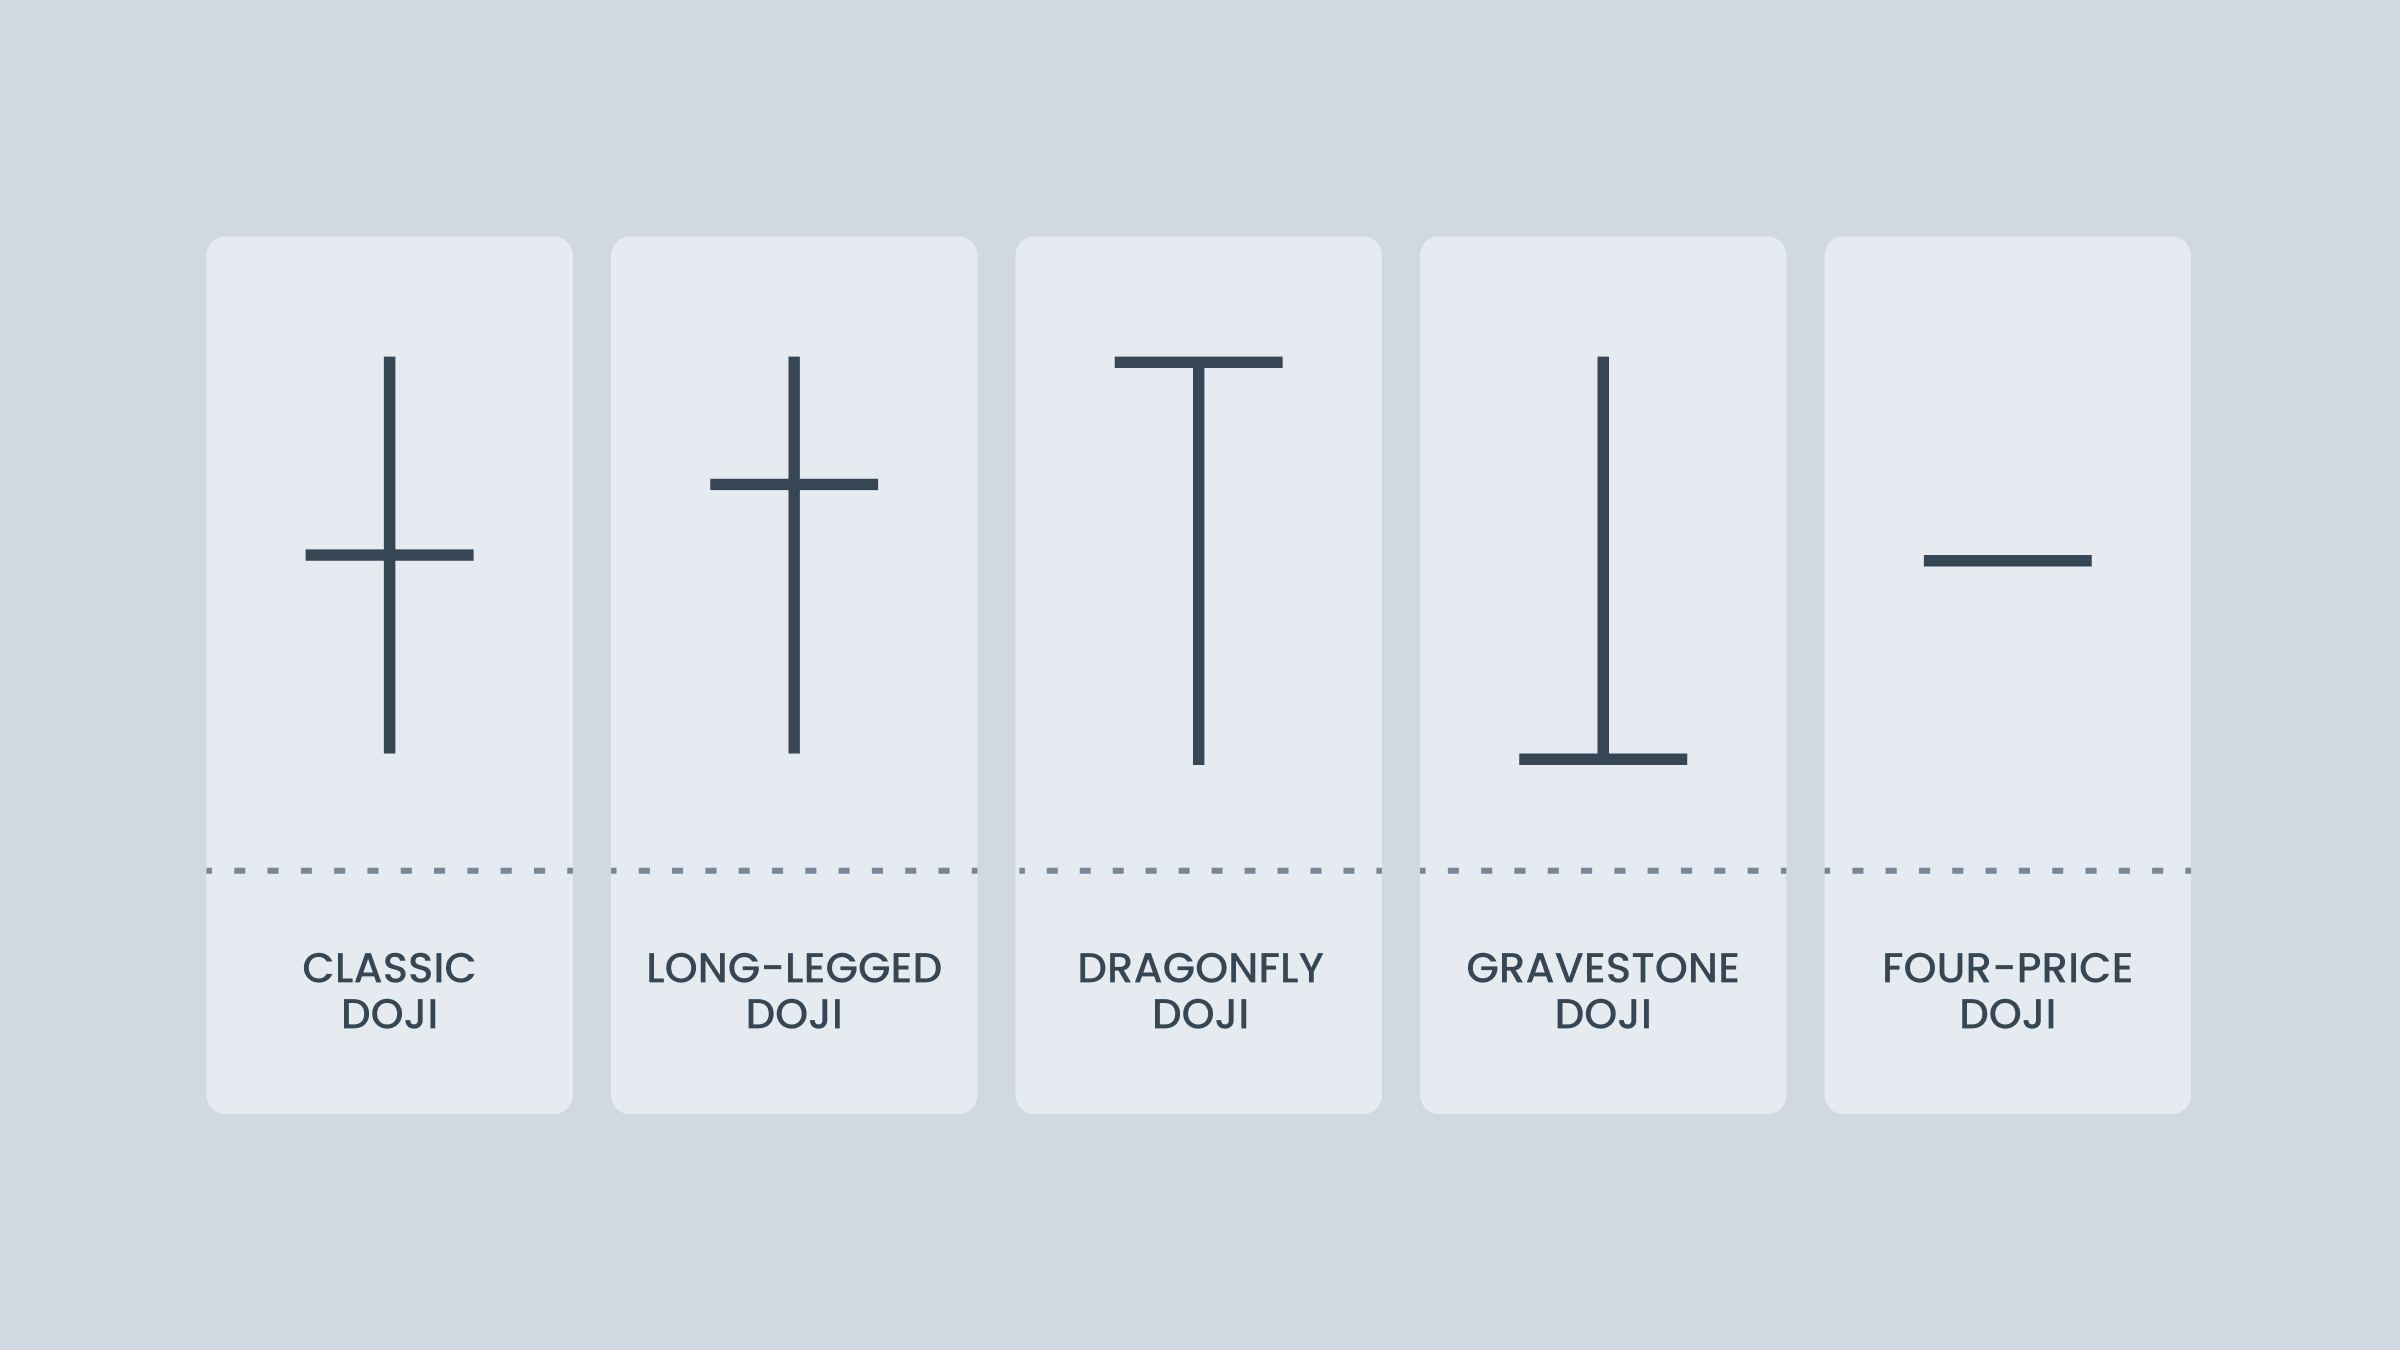
There are several distinct types of Doji candles, each providing unique insights into market conditions and the price trend. Understanding these variations is crucial for traders looking to refine their technical analysis and enhance their trading strategies.
1. Standard Doji
Standard Doji
Often called a "Common Doji," this pattern features a small body with shadows that are roughly equal in length, meaning a tight balance between buyers and sellers. It typically signals a period of consolidation before the market makes a more defined move.
Characteristics of a Standard Doji
A Standard Doji occurs when the price opens and closes at nearly the same level, which means there was no strong commitment from either side during that session.
Trading implications of a Standard Doji
The Standard Doji signals that market momentum is losing strength. This pattern indicates a possible market reversal or trend pause, but it does not provide a clear direction on its own. You should wait for a follow-up candle or confirmation from other indicators before deciding on a trade.
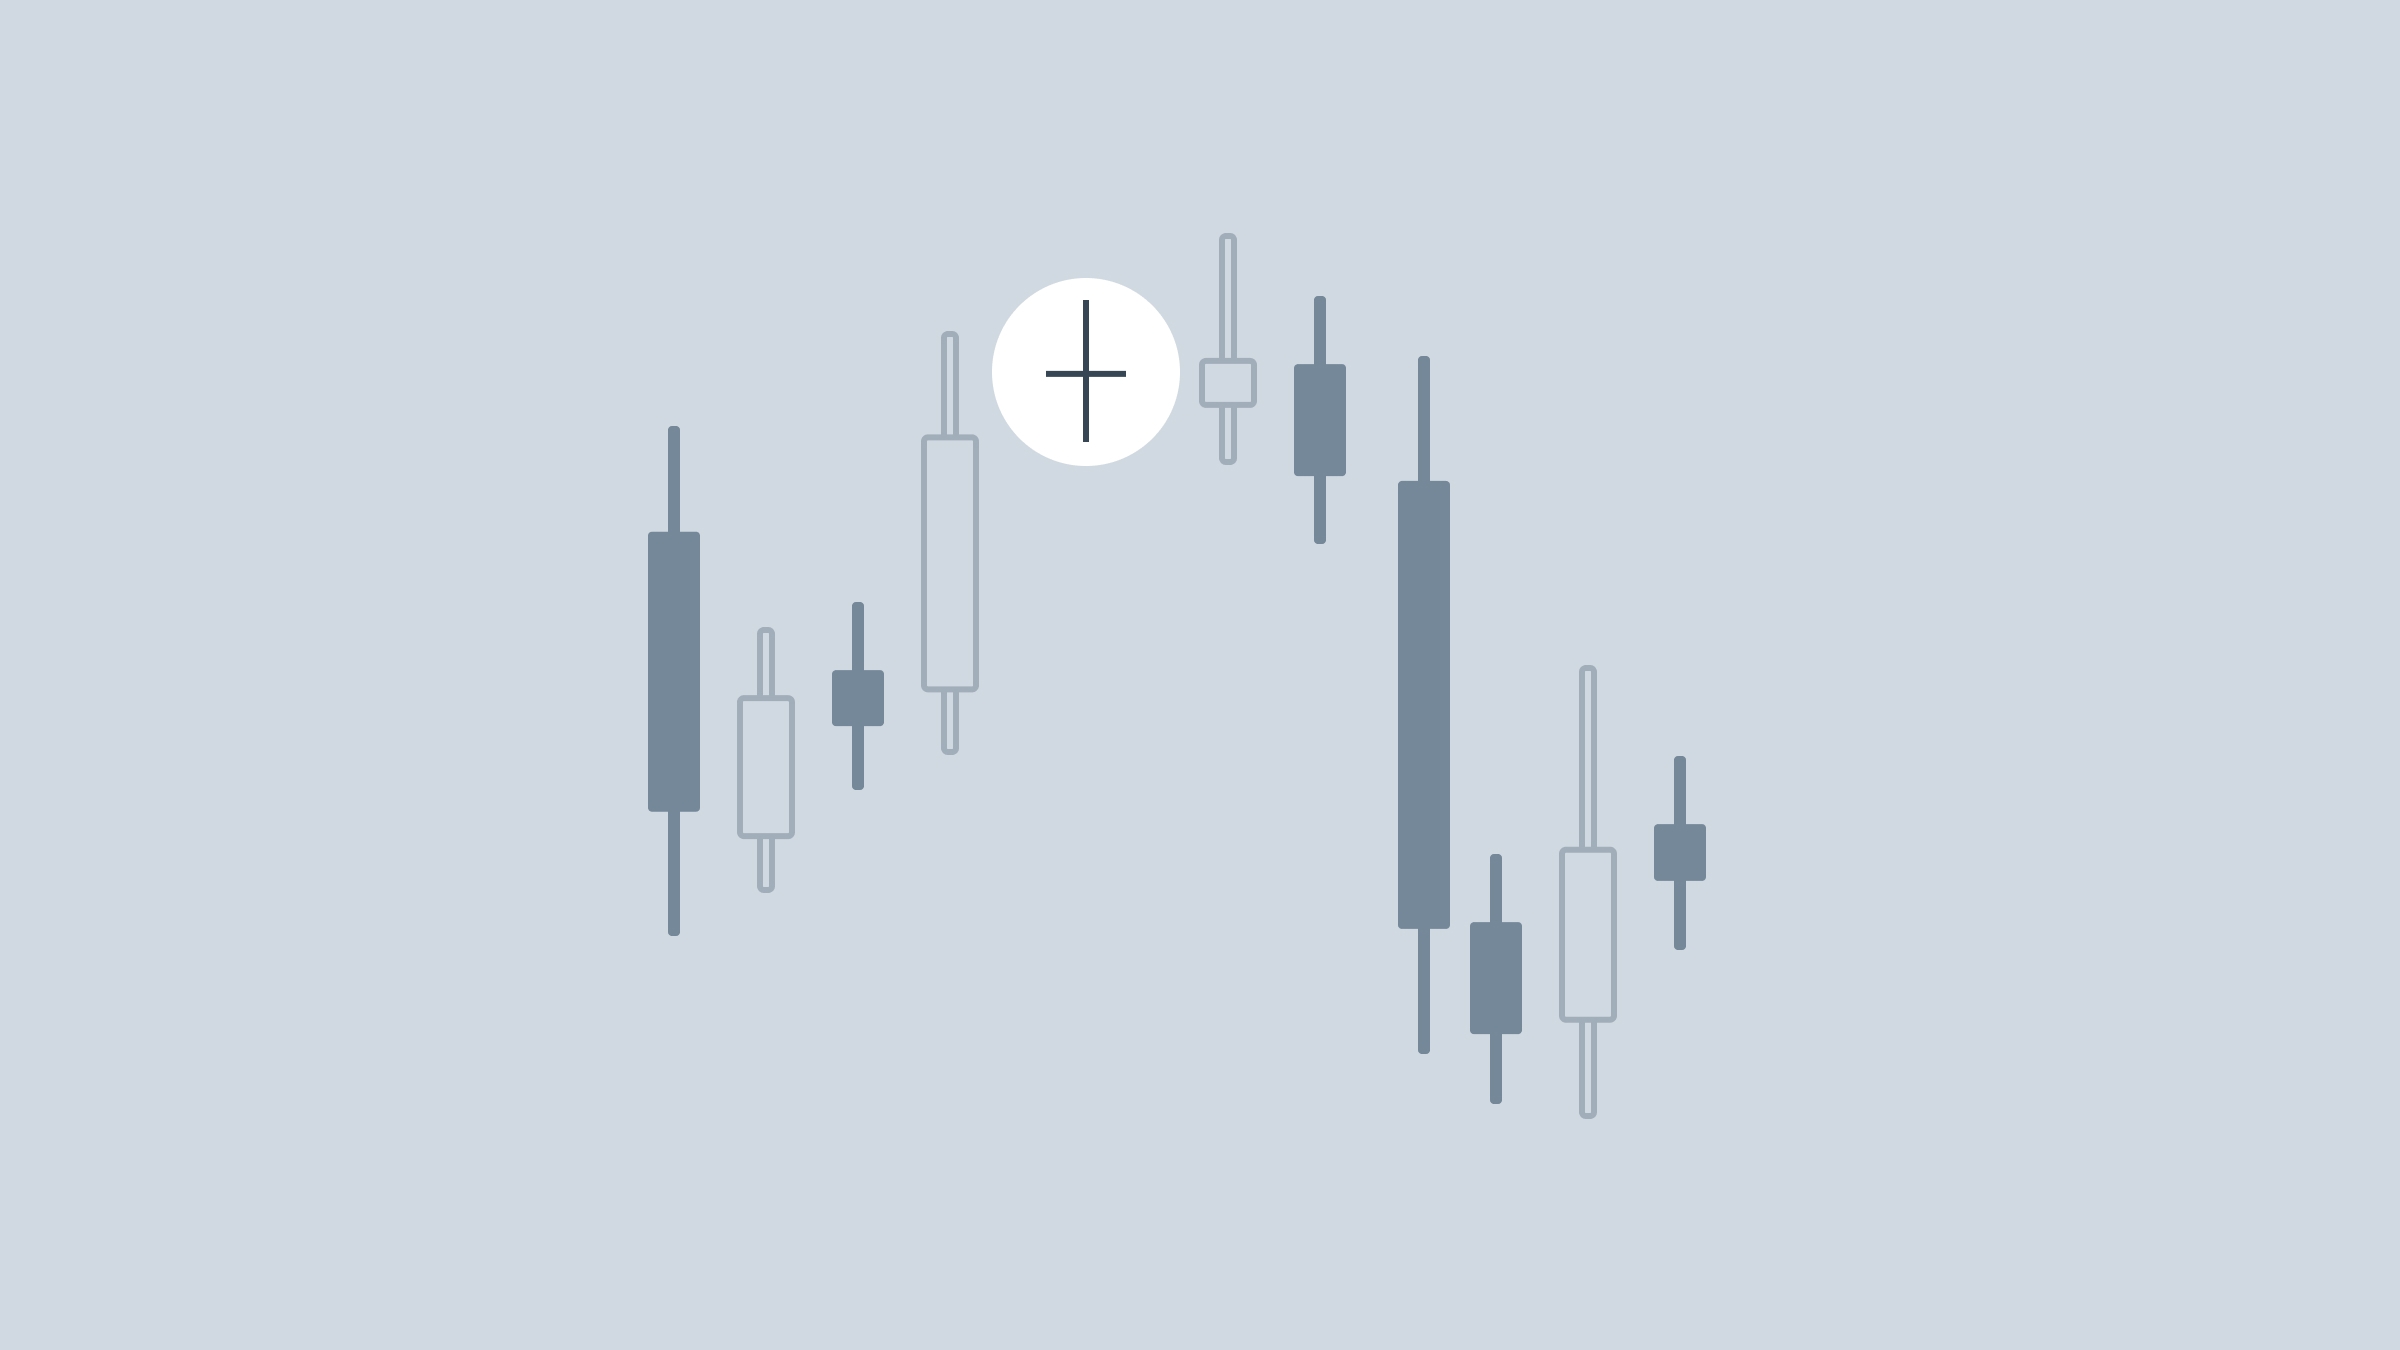
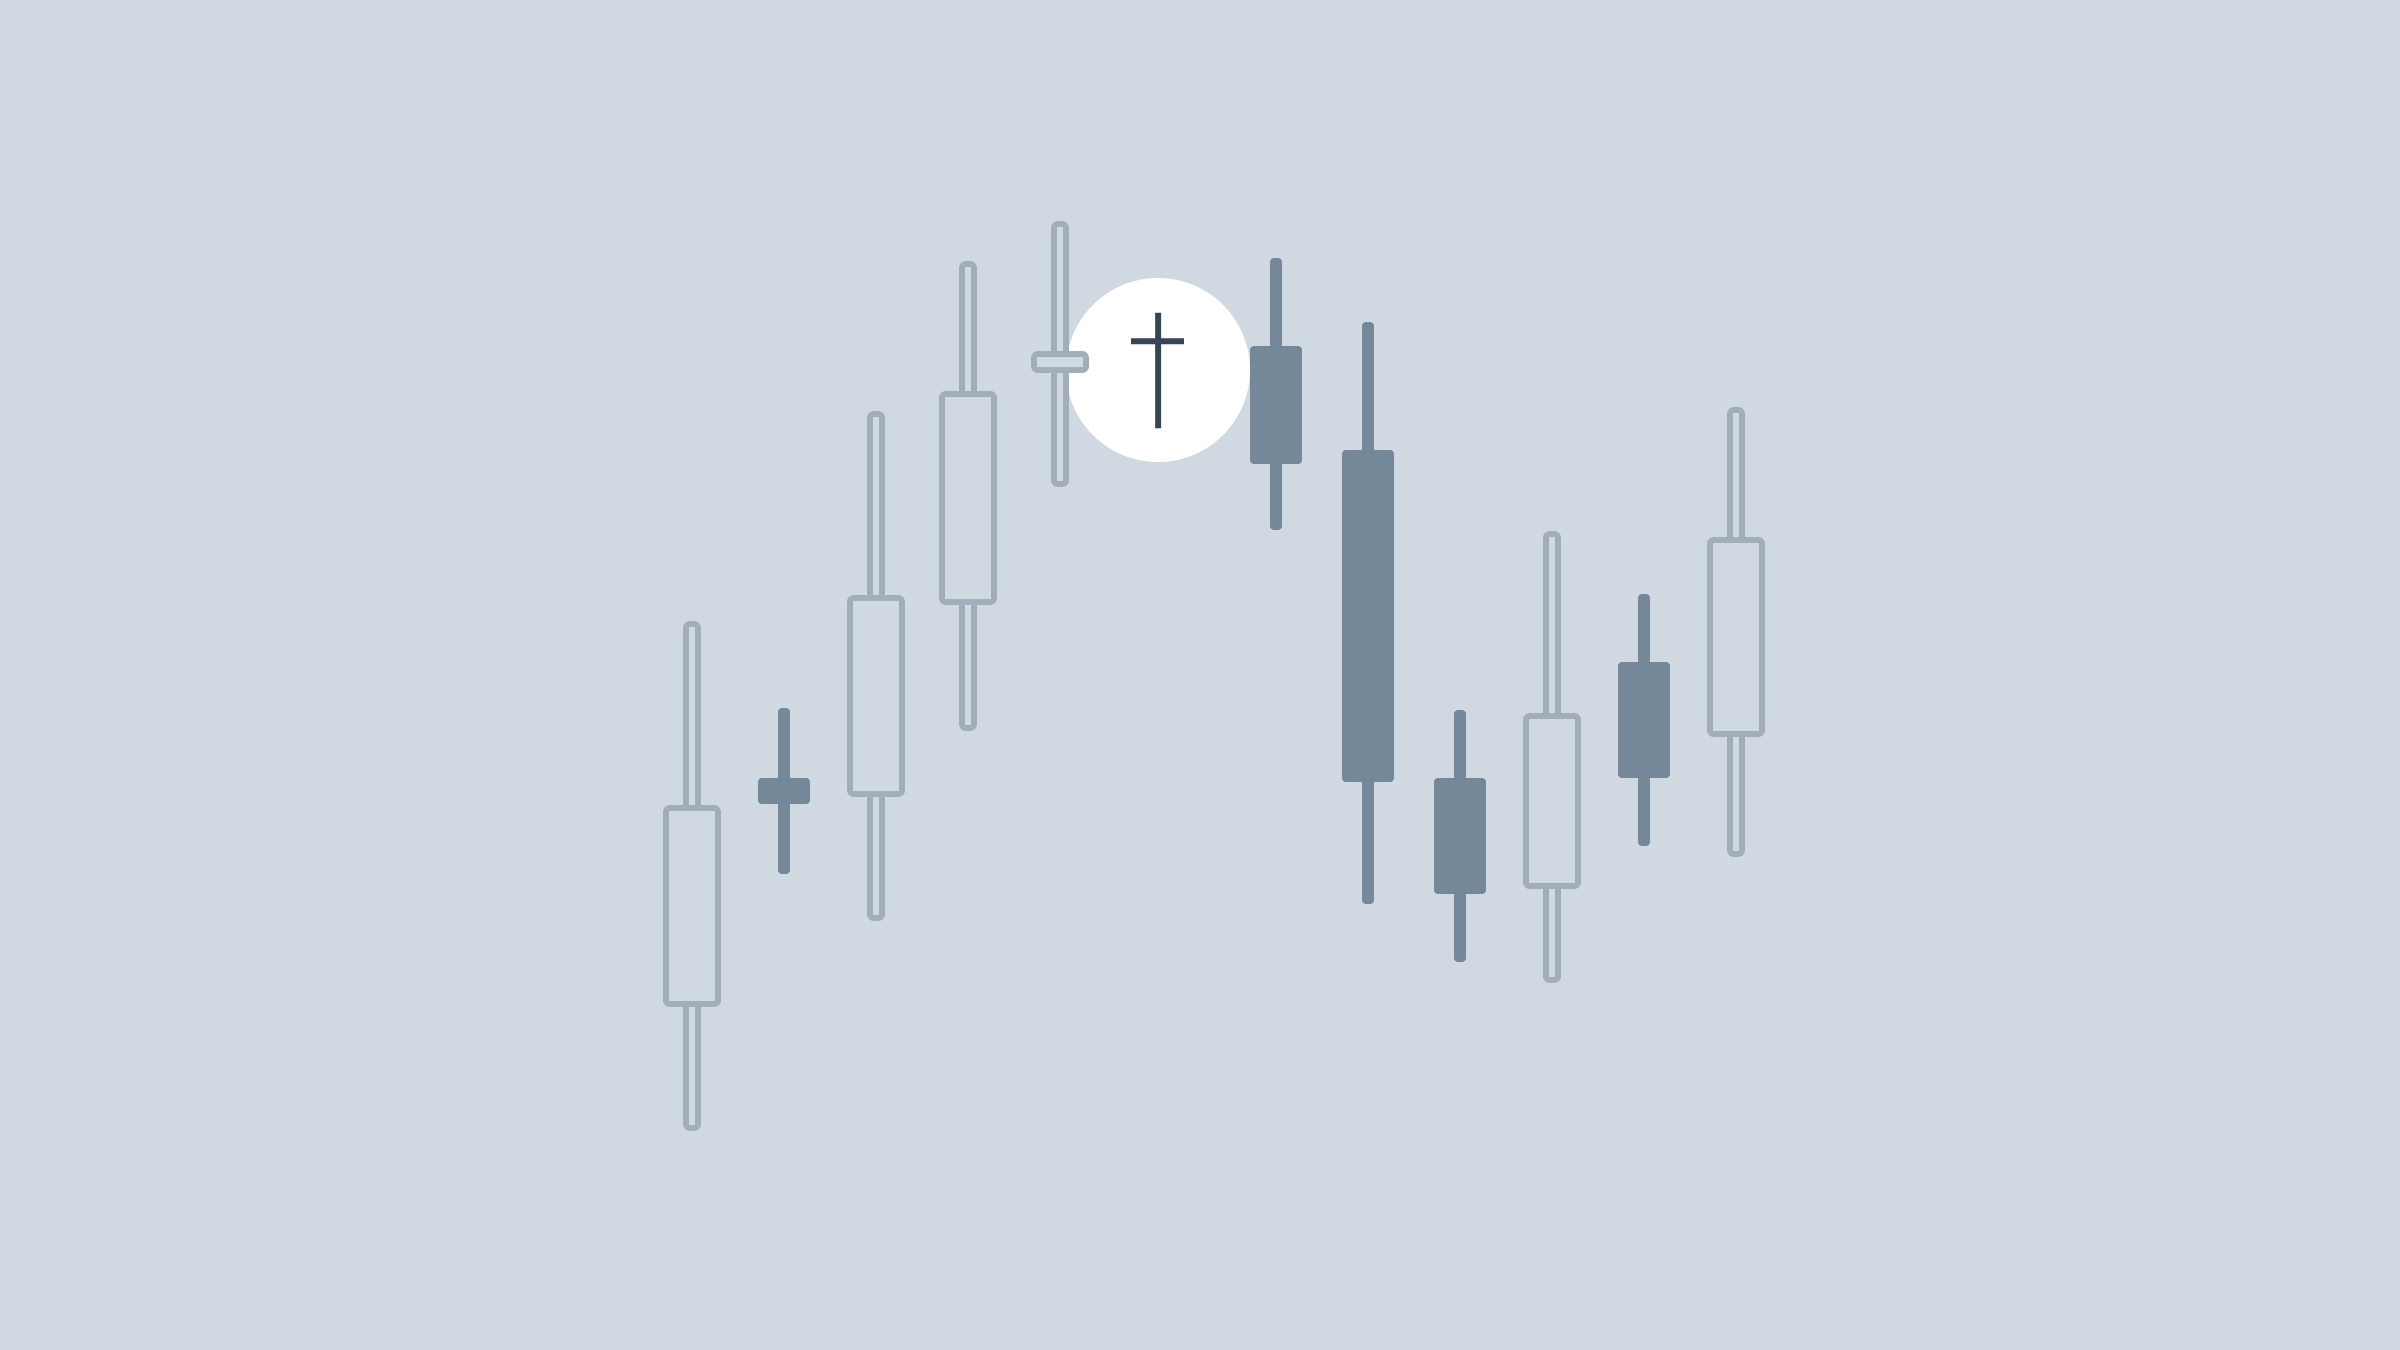
2. Gravestone Doji
Gravestone Doji
The Gravestone Doji candlestick is open, low, and close at the same level with a long upper shadow. This pattern suggests that buyers initially pushed prices higher, but sellers managed to bring it down to the opening level, often seen as a bearish reversal signal if it comes at the end of an uptrend.
Characteristics of a Gravestone Doji
The bearish Doji is a sign of uncertainty or market exhaustion, where the candlestick reflects that the bullish momentum has run out of steam. It also tends to occur in overbought conditions, where the market may be due for a correction.
Trading implications of a Gravestone Doji
The Gravestone Doji is one of the key trading signals to reassess long positions, particularly if it forms at the peak of a strong uptrend. The implications are amplified if this pattern is accompanied by higher volume. The confirmation of a bearish trend may be stronger if the next candlestick closes lower.
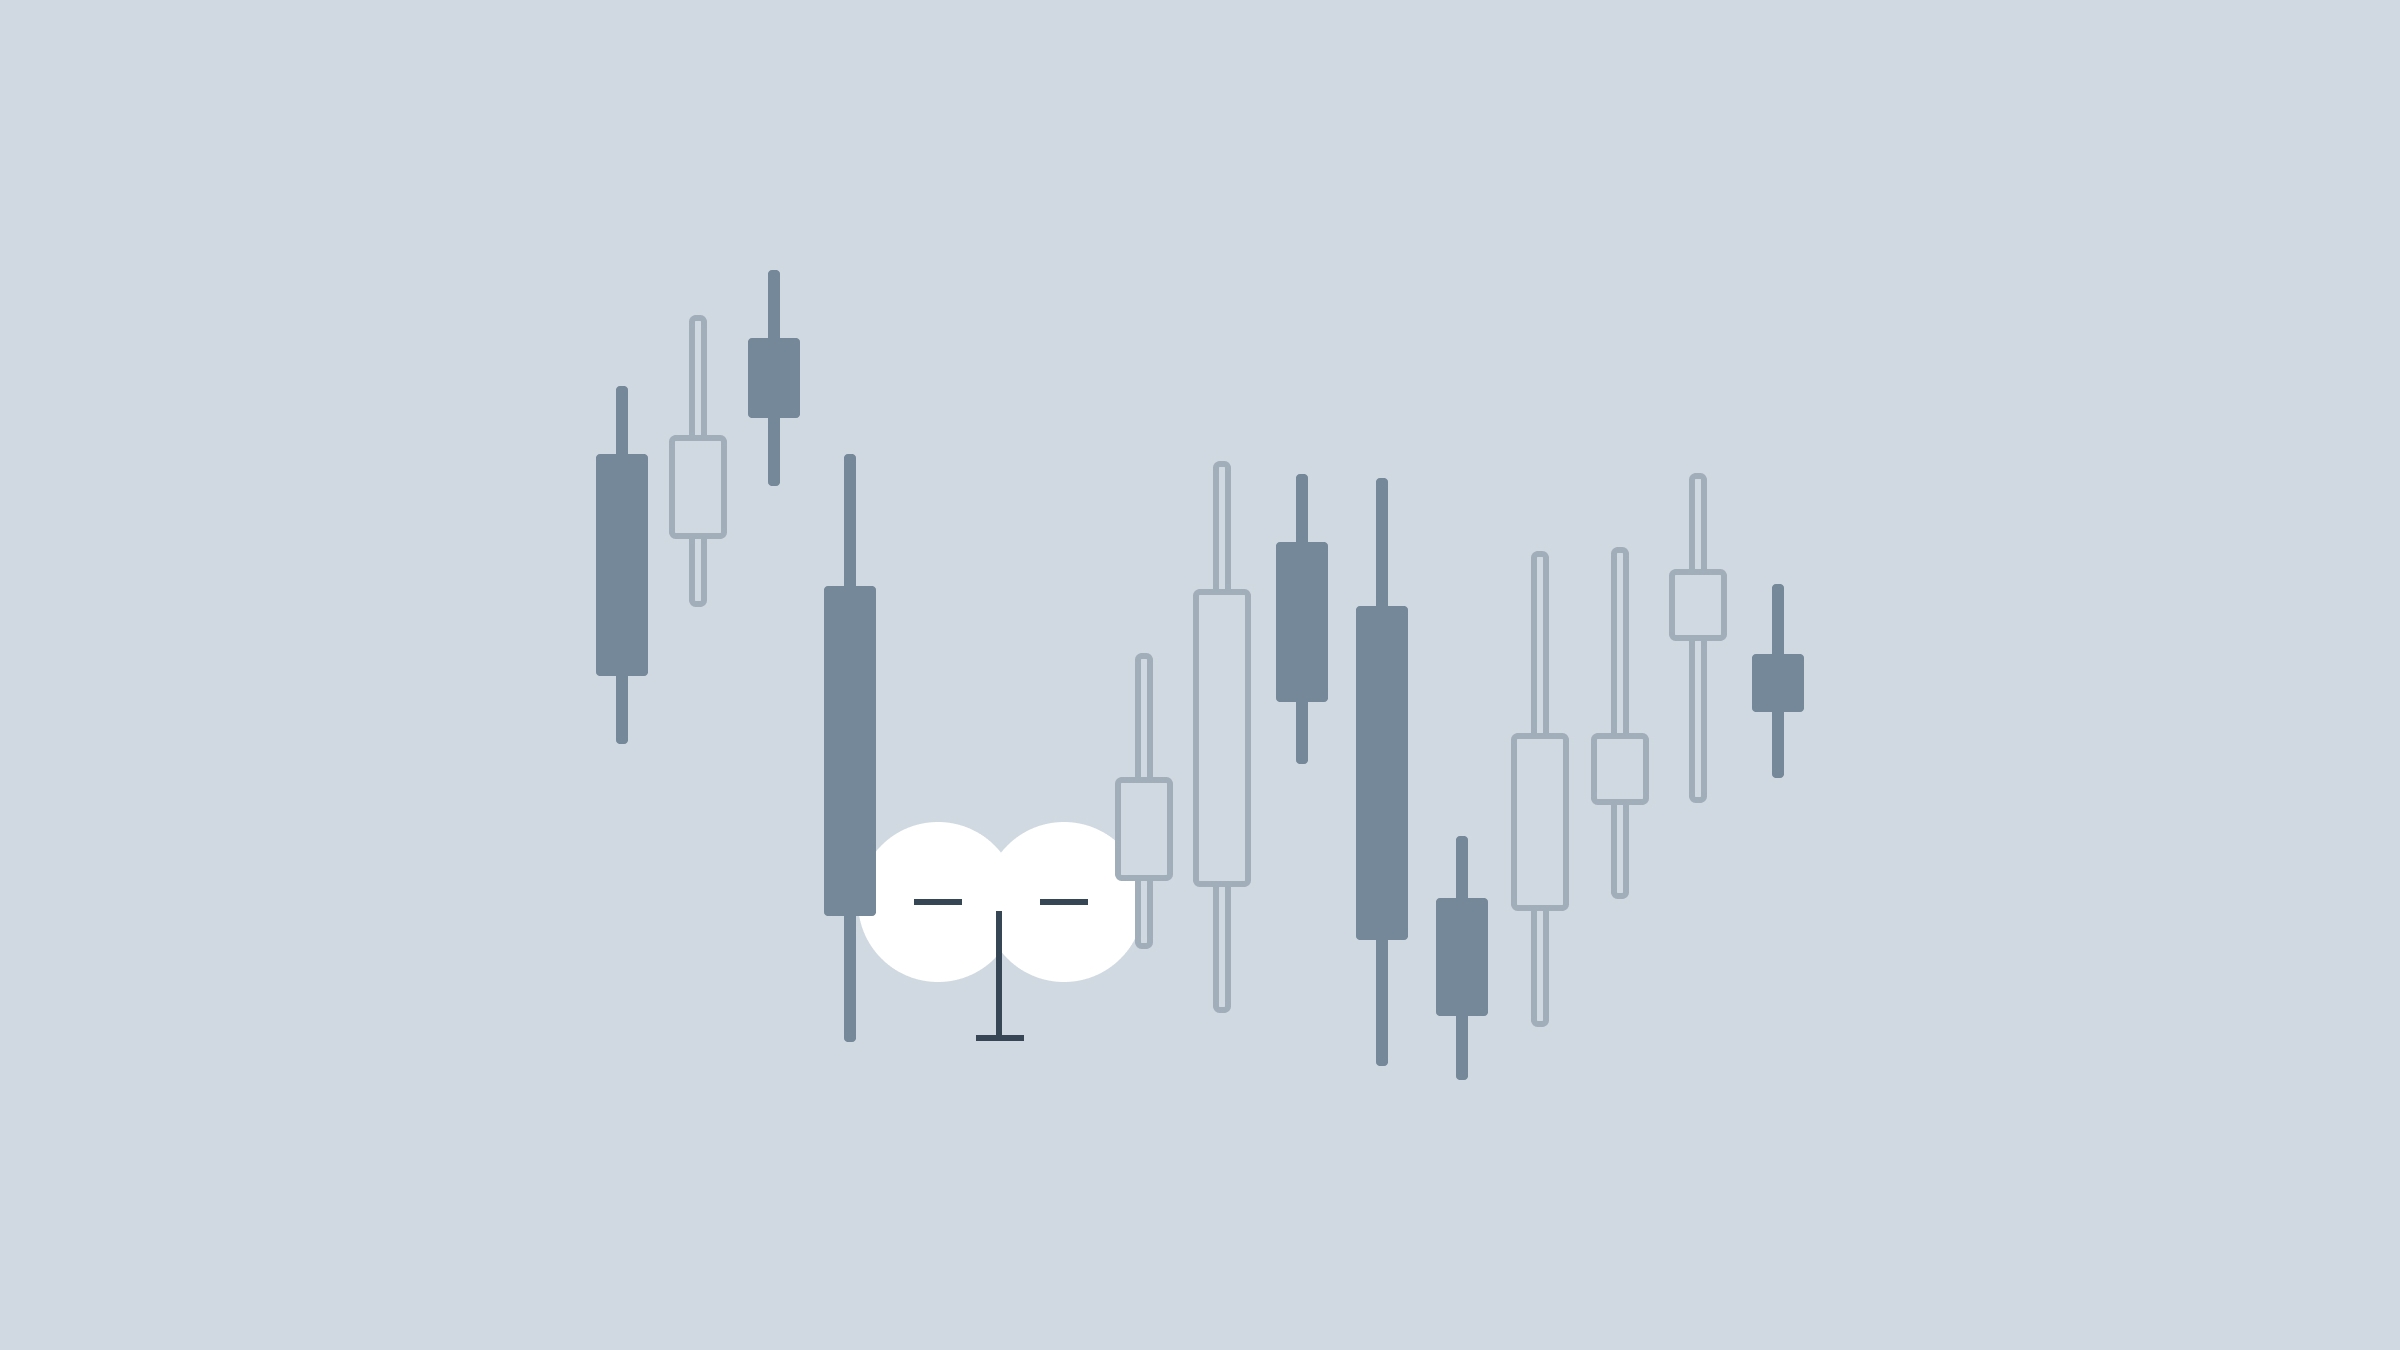
3. Dragonfly Doji
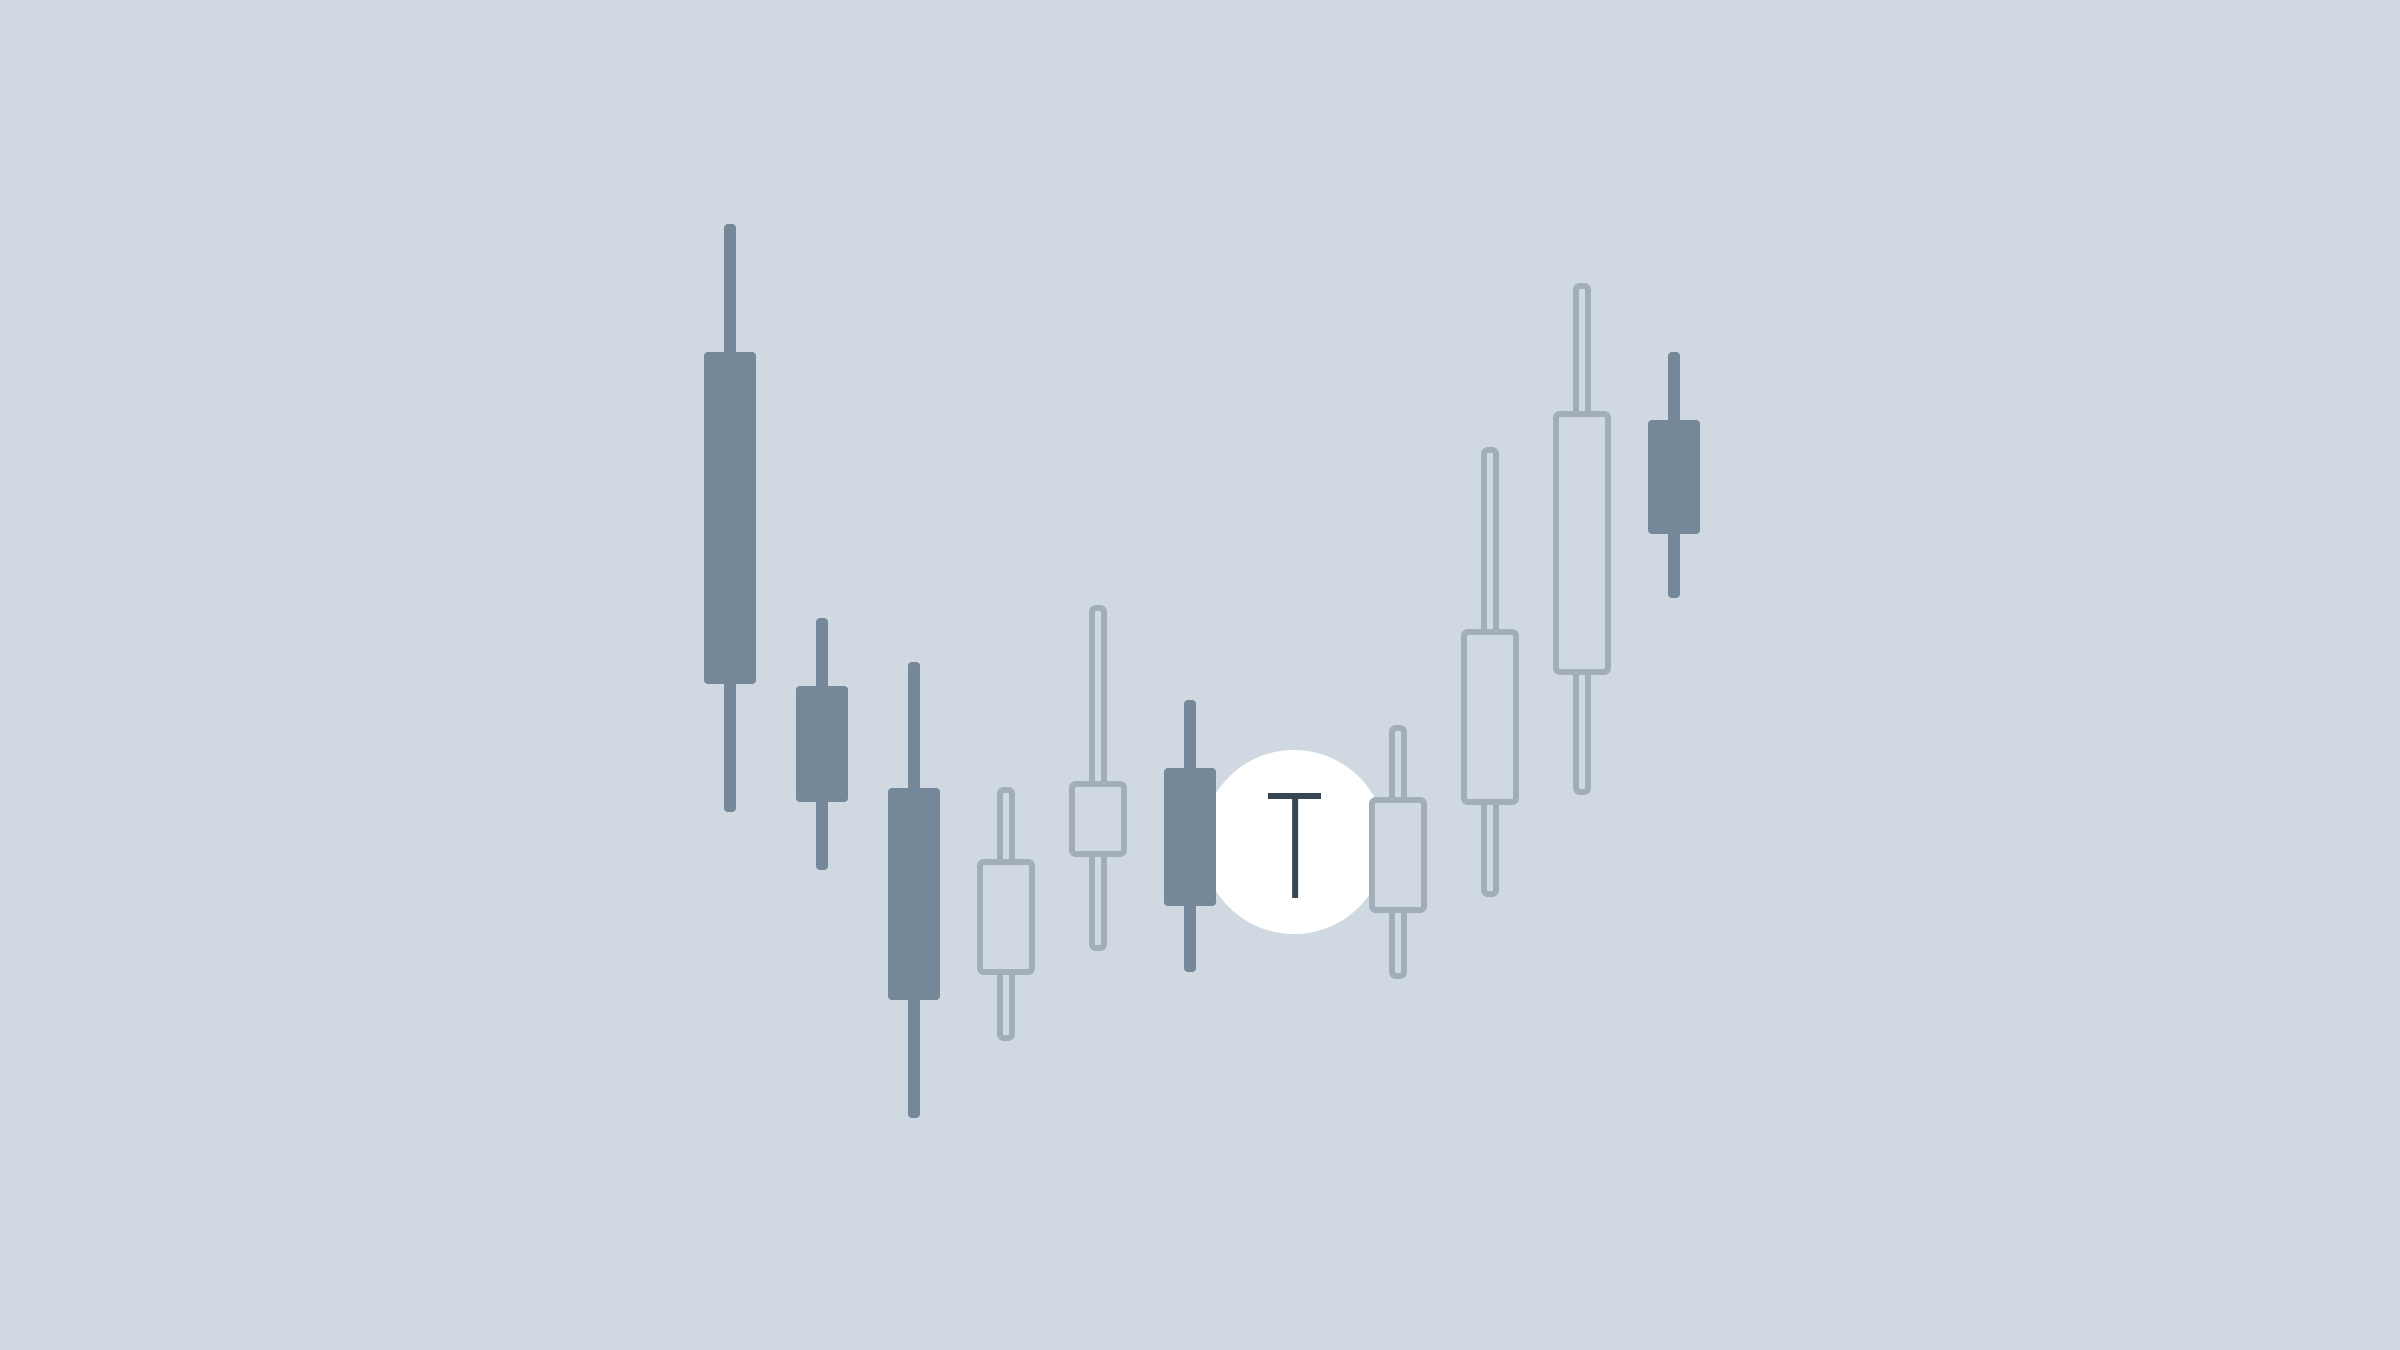
Dragonfly Doji
The Dragonfly Doji candlestick pattern occurs when the open, high, and close prices are at the same level, but there’s a significant tail below. It suggests that sellers drove the prices down during the session. Still, buyers were able to push it back up to opening level, indicating a potential bullish reversal if it occurs after a downtrend.
Characteristics of a Dragonfly Doji
Like a bullish Doji, it signals that the selling pressure might be exhausted. It forms in markets where volatility is high, yet the price does not significantly move above the opening level.
Trading implications of a Dragonfly Doji
When a Dragonfly Doji appears after a downtrend, it’s a potential signal to enter a long position, especially if it’s followed by bullish confirmation in the next candlestick. It’s essential to monitor the volume as well, because a higher volume after the pattern boosts its reliability as a reversal signal.
4. Long-legged Doji
Long-legged Doji
Known also as the "Rickshaw Man," the Long-legged Doji candlestick features long upper and lower shadows, which suggests extreme indecision as both bulls and bears attempt to control but end up nearly equal by the close. This type of Doji often appears after significant price movements and may signal a potential reversal or a considerable continuation of volatility.
Characteristics of a Long-legged Doji
Chart patterns like the Long-legged Doji emerge in both trending and range-bound markets and point to neither buyers nor sellers having gained clear dominance. It’s associated with high levels of market participation and found at points of market exhaustion.
Trading implications of a Long-legged Doji
Traders should avoid jumping into positions immediately, instead monitoring for any subsequent shifts in momentum. It could turn either way, so you should be aware of the surrounding market conditions, such as trend direction or consolidation.
5. Four-price Doji
Four-price Doji
This rare variation has open, close, high, and low prices simultaneously, showing an absolute balance and lack of volatility. It is a clear indecision pattern and can be seen in trading sessions with very low trading volume.
Characteristics of a Four-price Doji
The Four-price Doji is seen during periods of consolidation or at key turning points in the market. It indicates that no clear momentum has developed during the session.
Trading implications of a Four-price Doji
It’s important to be cautious because this pattern doesn’t give a clear signal on its own. It may turn out to be a reversal Doji candlestick, but the market could also continue in the same direction. Wait for further price movement or confirmation from other indicators before making a move.
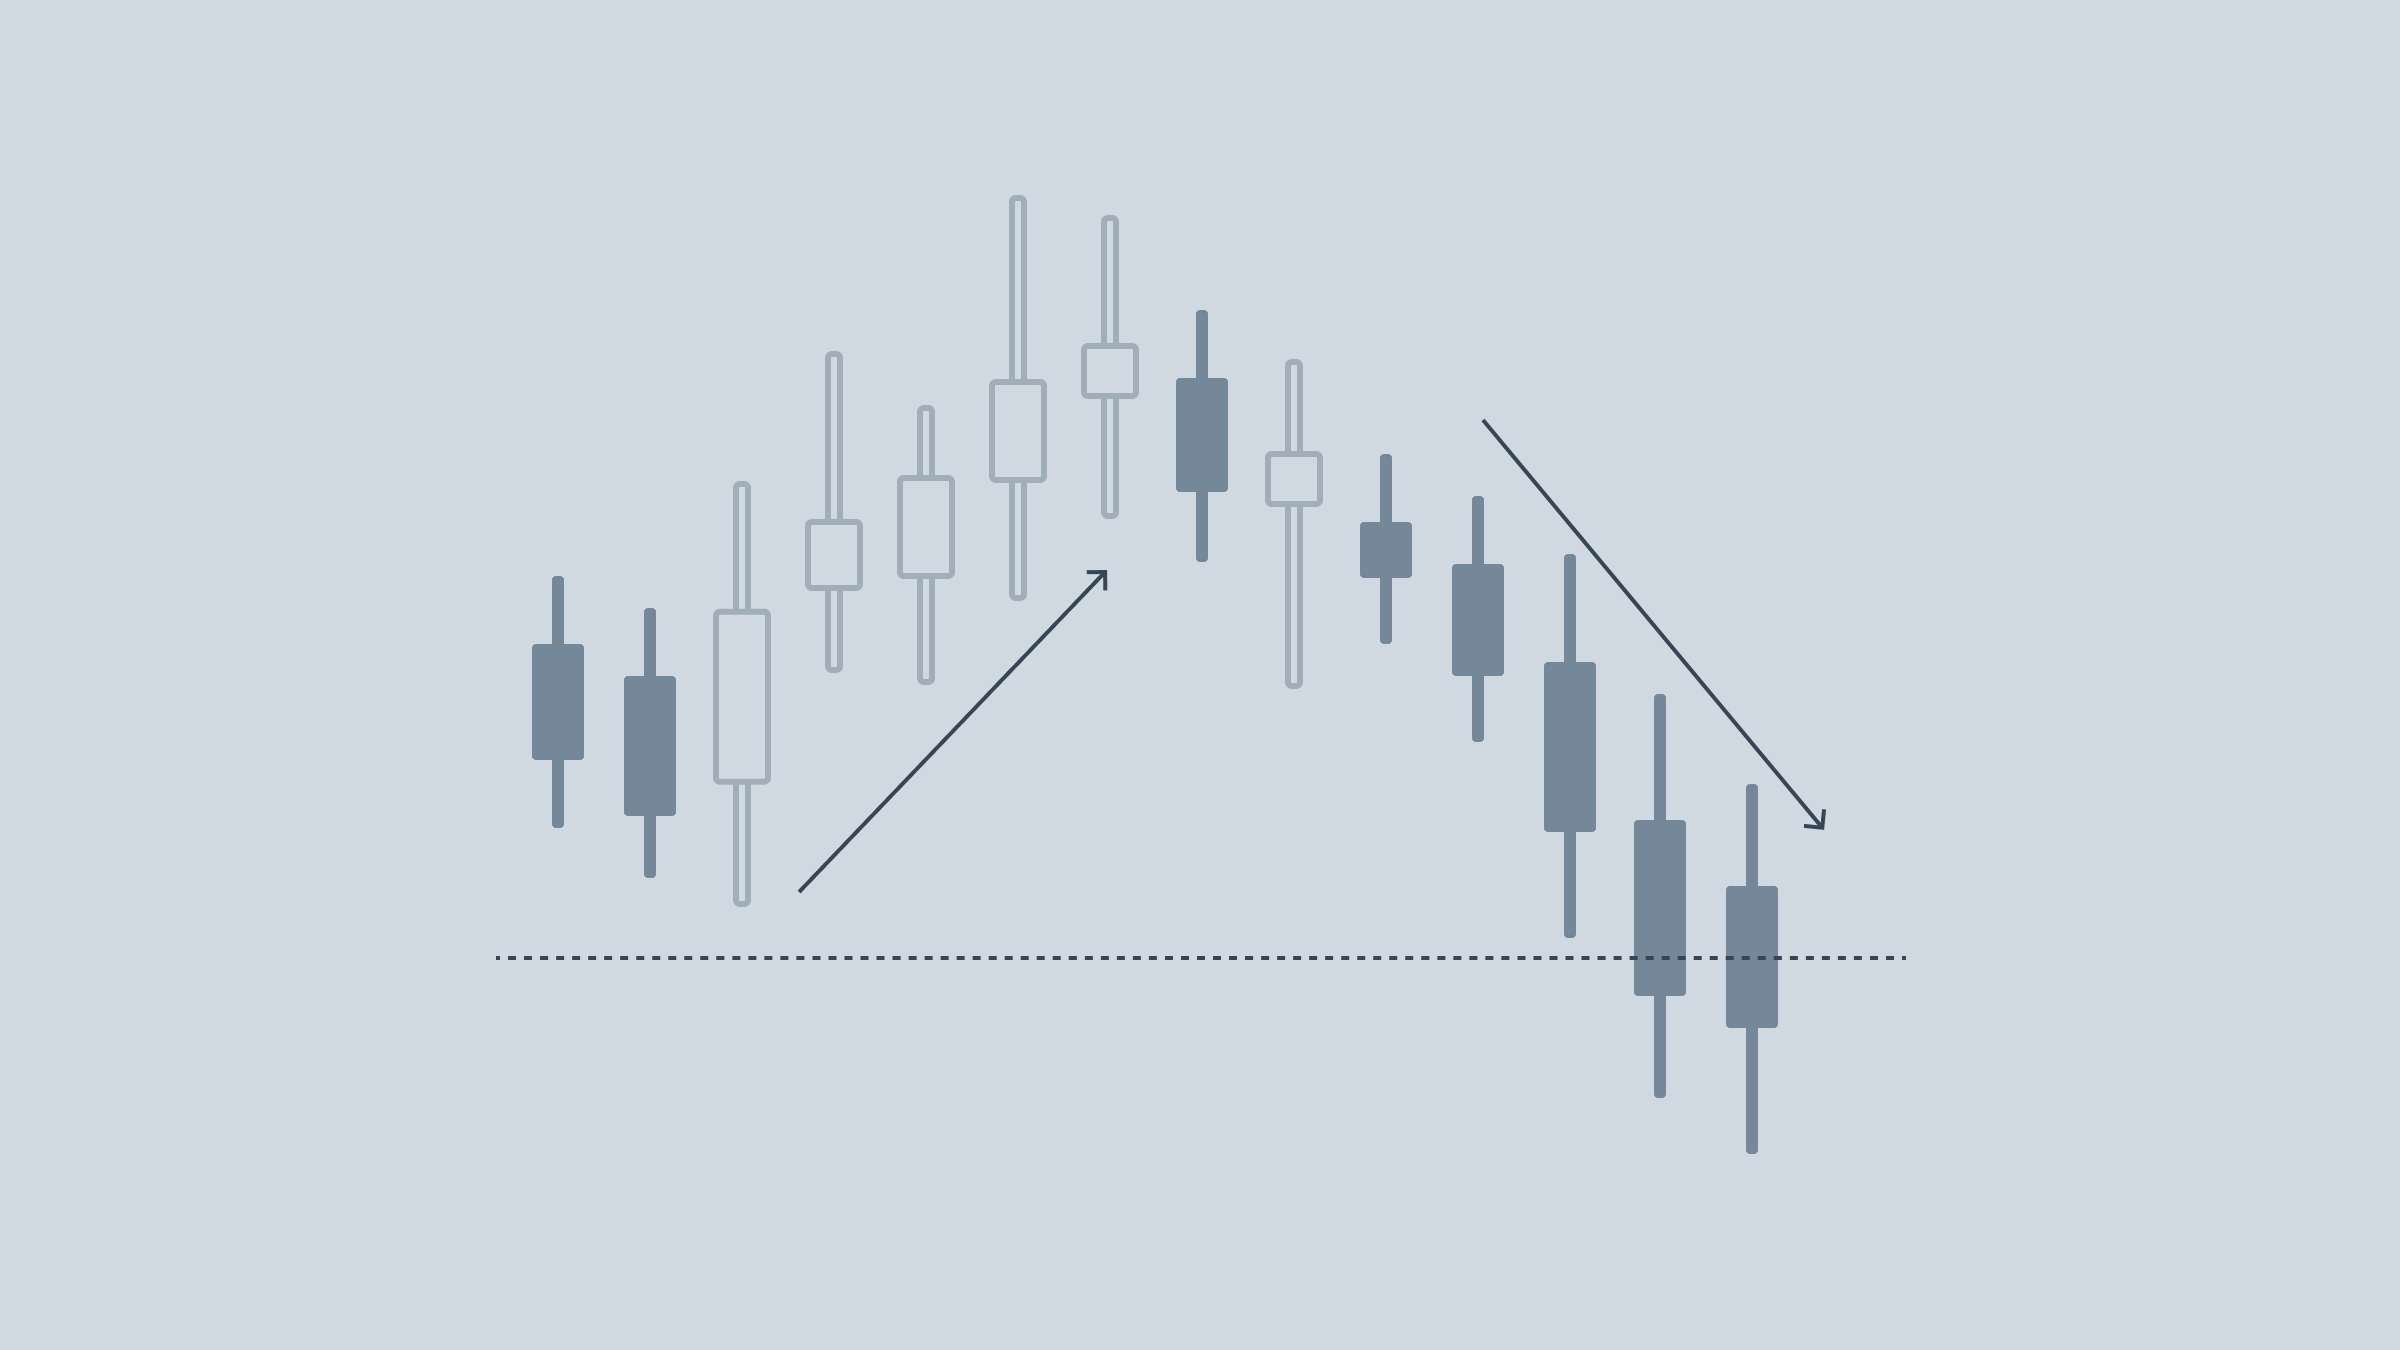
How to trade using Doji candlestick patterns

Doji on a chart
A candlestick chart is a pivotal aspect of technical analysis, providing deep insights into market psychology and potential price movements. Beyond recognizing specific types of Doji candles, successful traders integrate these patterns into broader trading and investment strategies. Here’s how you can expand your trading acumen with candlestick patterns: