Understanding bullish and bearish harami patterns
Bullish and bearish harami patterns are relatively common patterns that appear in the candlestick charts and can signify a reversal in the market.
According to research by Thomas Bulkowski, the bullish harami ranks 25th in frequency compared to 103 candlestick patterns, meaning that they appear quite often in price charts. Similar data is also found when it comes to bearish patterns.
Given their high frequency of appearance, it’s important for traders to understand the main characteristics of these patterns and what they mean. Check out the table below for a side-by-side comparison:
|
Bullish harami
|
Bearish harami
|
|
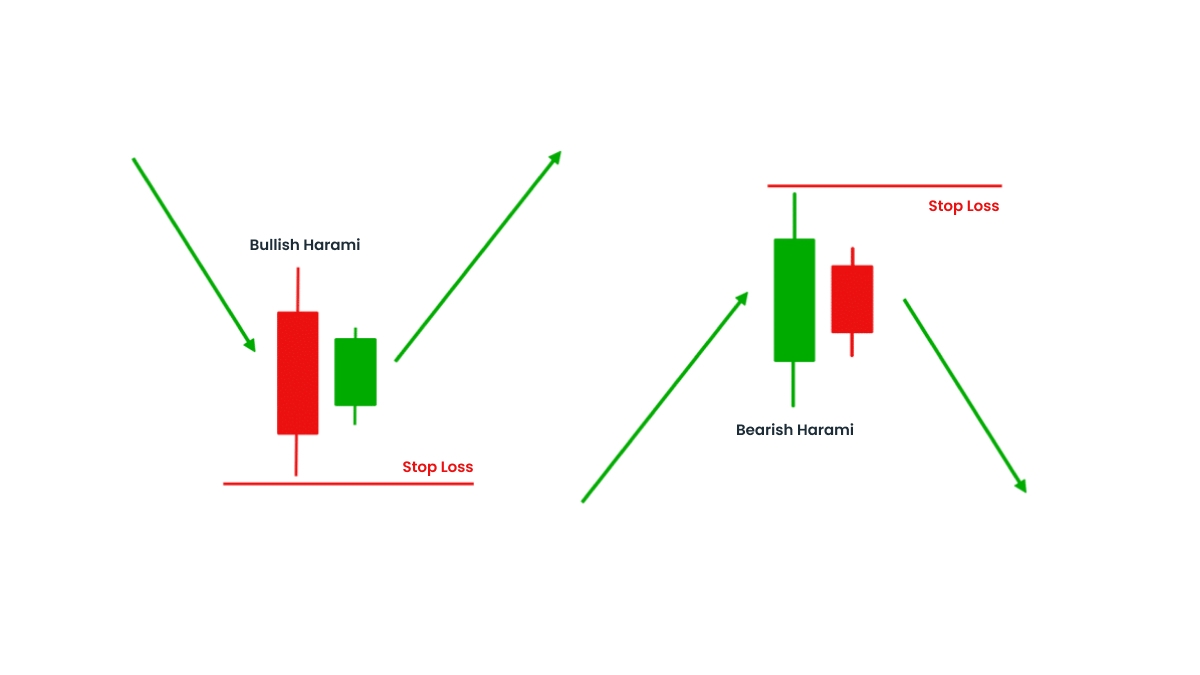
Starts at the end of a downtrend
|
Starts at the end of an uptrend
|
|
It’s a sign that the market is reversing to an uptrend
|
It’s a sign that the market is reversing to a downtrend
|
|
It means bears (sellers) are losing power and bulls (buyers) are gaining control
|
It means bulls (buyers) are losing power and bears (sellers) are gaining control
|
|
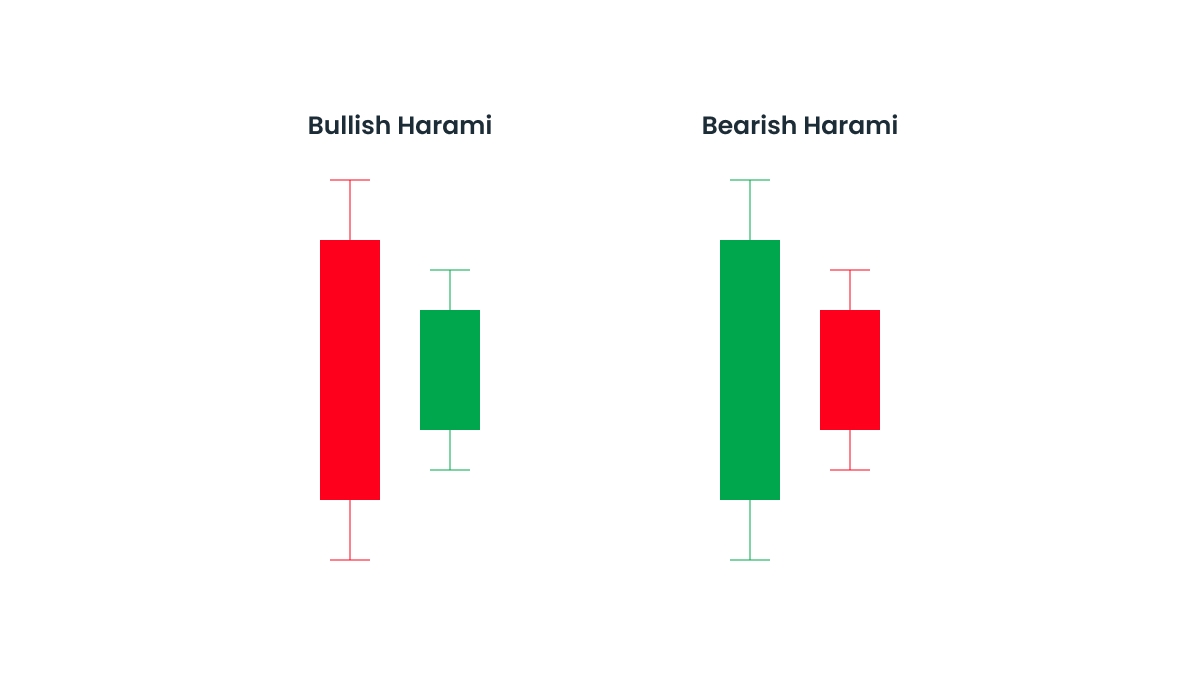
The first candle is a red or black large one (bearish candle)
|
The first candle is a green or white one (bullish candle)
|
|
The second smaller candle is a green or white one completely within the range of the first (bullish candle)
|
The second smaller candle is a red or black one completely within the range of the first (bearish candle)
|
As mentioned above, both patterns are quite common, but it’s important to note that they shouldn’t be used as a sign of confirmation in isolation, and both of them can benefit from broader analysis with other metrics.
The psychology behind harami patterns
Harami patterns can help traders understand better how the market is feeling about a specific asset at a certain moment in time. It’s a strong signal of market indecision and potential to change, going from one direction to another.
With bullish harami, traders can see that sellers are losing control and that buyers are starting to notice the potential growth of the asset and take action.
Alternatively, a bearish harami pattern is a sign that buyers are losing confidence in the asset and sellers are starting to dominate the market.
An appearance of a harami pattern is a clear visual sign that the market is in an in-between moment, getting ready for a possible reversal of the previous trend.
How to identify a bullish or bearish harami pattern
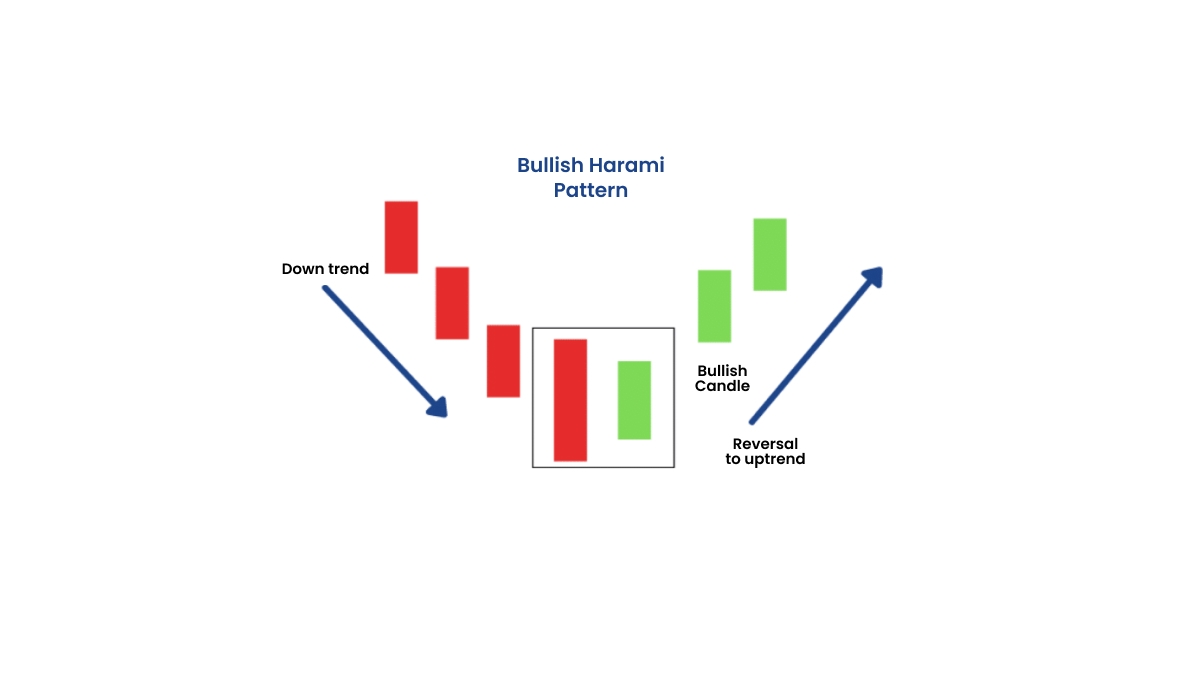
Here’s a step-by-step guide to spot a bullish harami pattern in a candlestick chart:
-
Identify a significant downtrend in the chart.
-
Look for a large bearish candle that continues the downtrend.
-
Check if the second candle is bullish and if it fits inside the first one.
-
Confirm the new trend by checking if the third and fourth candlesticks are also bullish, starting an effective uptrend in the chart.
-
Use other indicators and complementary information to back up the possibility of the new trend.
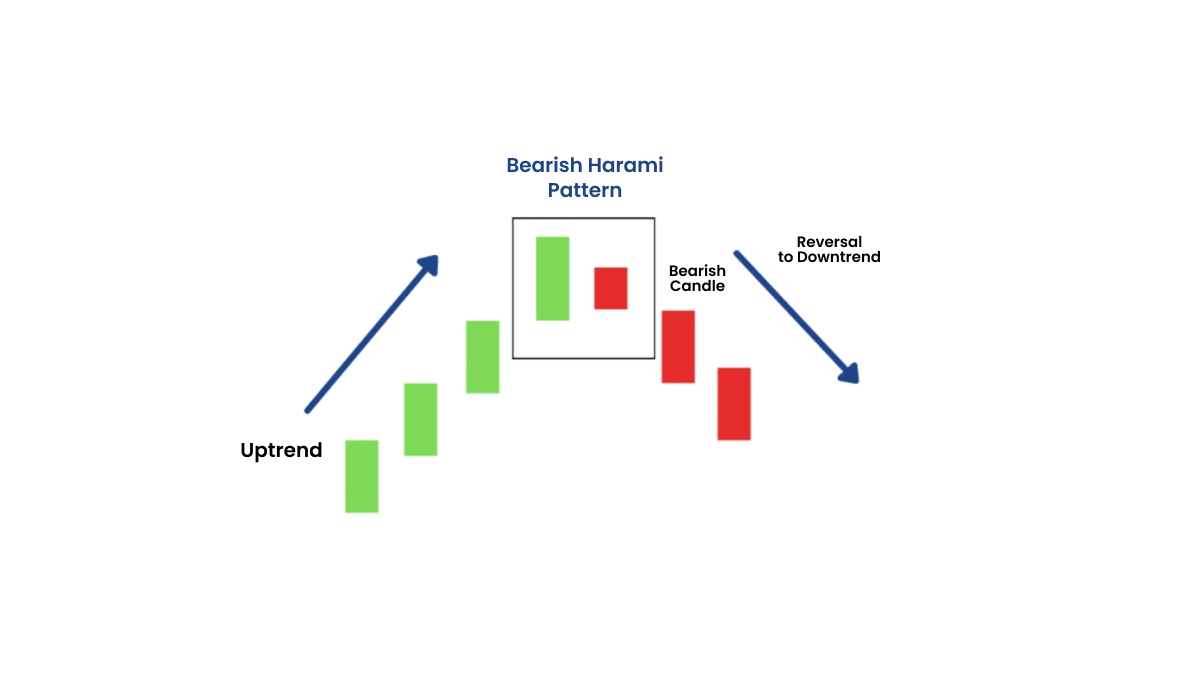
The logic is the same when it comes to recognizing a bearish harami pattern in a candlestick chart, but reversed:
-
Identify a significant uptrend in the chart.
-
Look for a large bullish candle that finishes the uptrend.
-
Check if the second candle is bearish and if it fits inside the first one.
-
Confirm the new trend by checking if the third and fourth candlesticks are also bearish, starting an effective downtrend in the chart.
-
And similarly, do your research with other indicators and more information to validate the possibility of the new trend.