
Introduction
Candlestick patterns are popular formations in candlestick charts that can represent a change in market sentiment and can help predict the next price movements.
They are important tools for traders in many different markets because by spotting them early enough traders can get a glimpse of a changing market and adjust their strategies accordingly in a timely manner.
In that category, the harami candlestick patterns are two famous patterns that can indicate a reversal in the previous trend of the market. They are the bullish and bearish harami patterns, and in this article, we will explain how you can identify them and start using them in your trading strategies.
Whether you are a novice or an experienced trader, these can be powerful tools to assist you with the hardest thing a trader must do: predict the next shifts in the market and use them to their favor.
What is a candlestick chart?
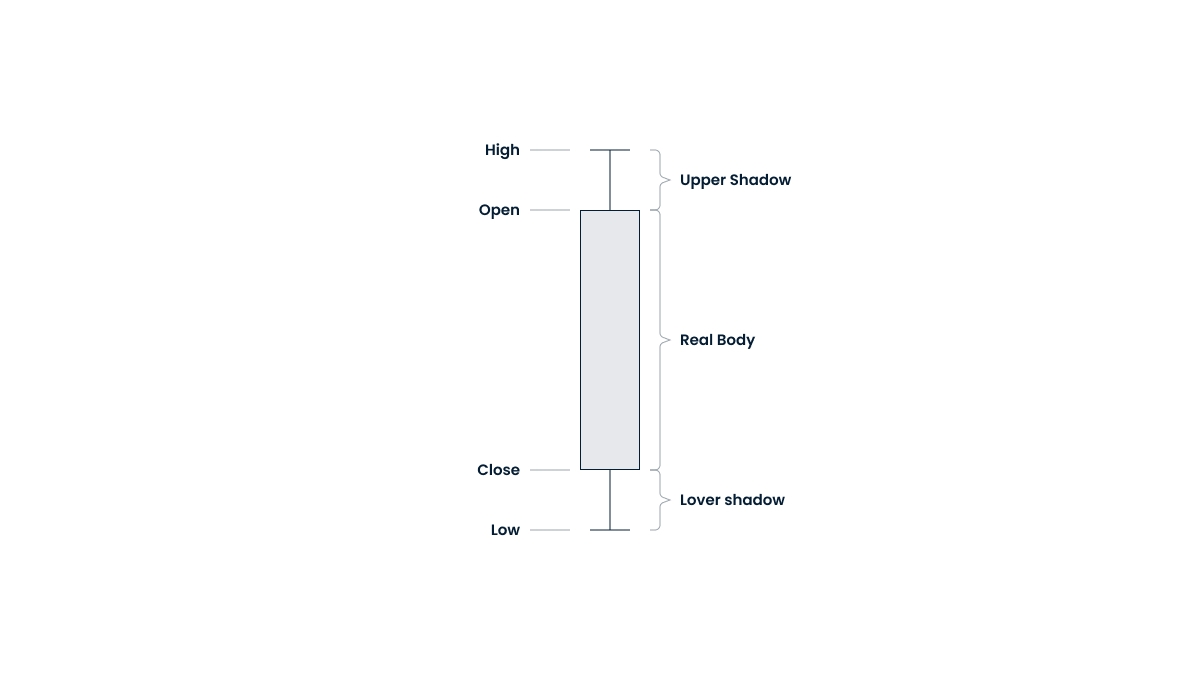
A candlestick chart is a type of chart that shows in a visual way the price movements of an asset inside a market.
Each candle contains four crucial pieces of information:
The top of the body is the open price of the asset in that specific time frame.
The bottom of the body is the close price.
The wick at the top is the highest price that the asset has reached.
The wick at the bottom is the lowest price that the asset has reached.
The candles can represent different time frames, like daily, weekly, monthly, or even intraday with hourly updates. However, daily candlestick charts are by far the most common ones, representing a full day of price variations without getting too specific.
Since responding rapidly to the market is crucial for traders, candlestick charts are a great tool to analyze market behavior quickly due to their visual nature and easy-to-spot important price variations during the studied time frame. With practice, they can become easy to interpret and can help traders make informed decisions about their next steps.
Additionally, patterns that regularly appear on the charts, like harami patterns, are essential to predicting price movements and subtle (or blatant) changes in market direction.
What are harami candlestick patterns?
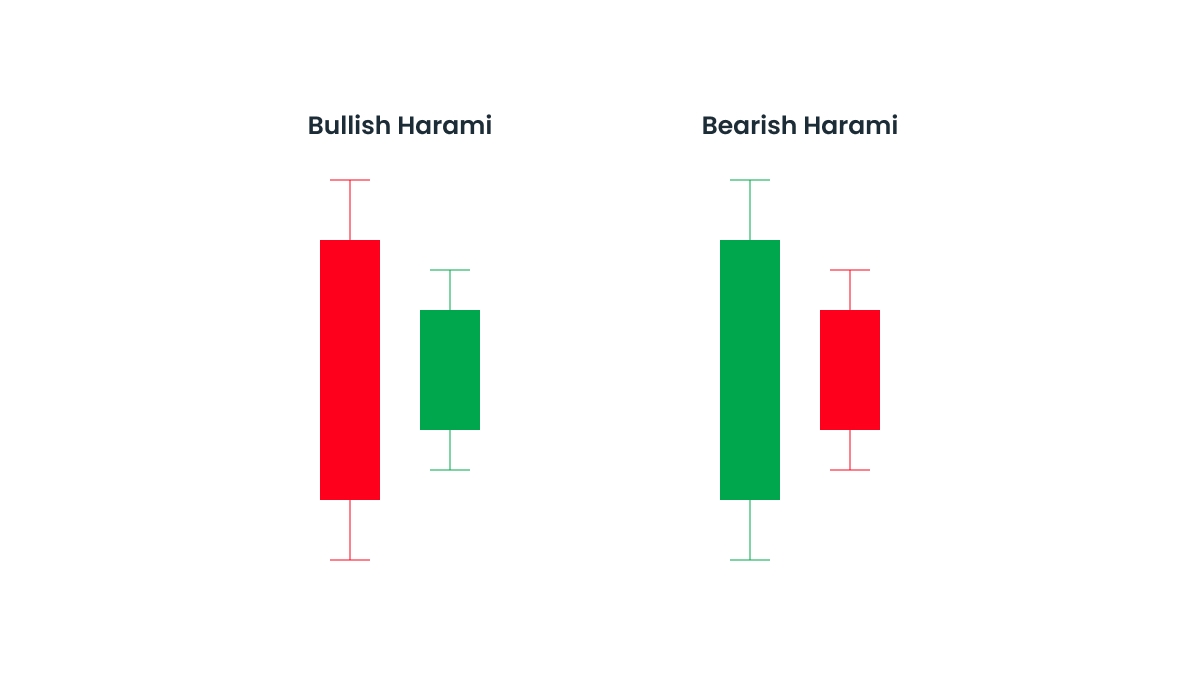
Harami candlestick patterns are two-candle patterns that can represent a reversal in a market trend.
The first candle is always bigger and the second is a smaller candle whose body is completely within the size of the first one.
They are a powerful sign that the market might change its direction, whether it’s a downtrend (bearish) that’s becoming an uptrend (bullish) or vice-versa.
A bullish harami pattern happens when:
Conversely, a bearish harami pattern happens when:
Here are visual representations of both patterns:
Understanding bullish and bearish harami patterns
Bullish and bearish harami patterns are relatively common patterns that appear in the candlestick charts and can signify a reversal in the market.
According to research by Thomas Bulkowski, the bullish harami ranks 25th in frequency compared to 103 candlestick patterns, meaning that they appear quite often in price charts. Similar data is also found when it comes to bearish patterns.
Given their high frequency of appearance, it’s important for traders to understand the main characteristics of these patterns and what they mean. Check out the table below for a side-by-side comparison:
|
Bullish harami
|
Bearish harami
|
|
Starts at the end of a downtrend
|
Starts at the end of an uptrend
|
|
It’s a sign that the market is reversing to an uptrend
|
It’s a sign that the market is reversing to a downtrend
|
|
It means bears (sellers) are losing power and bulls (buyers) are gaining control
|
It means bulls (buyers) are losing power and bears (sellers) are gaining control
|
|
The first candle is a red or black large one (bearish candle)
|
The first candle is a green or white one (bullish candle)
|
|
The second smaller candle is a green or white one completely within the range of the first (bullish candle)
|
The second smaller candle is a red or black one completely within the range of the first (bearish candle)
|
As mentioned above, both patterns are quite common, but it’s important to note that they shouldn’t be used as a sign of confirmation in isolation, and both of them can benefit from broader analysis with other metrics.
The psychology behind harami patterns
Harami patterns can help traders understand better how the market is feeling about a specific asset at a certain moment in time. It’s a strong signal of market indecision and potential to change, going from one direction to another.
With bullish harami, traders can see that sellers are losing control and that buyers are starting to notice the potential growth of the asset and take action.
Alternatively, a bearish harami pattern is a sign that buyers are losing confidence in the asset and sellers are starting to dominate the market.
An appearance of a harami pattern is a clear visual sign that the market is in an in-between moment, getting ready for a possible reversal of the previous trend.
How to identify a bullish or bearish harami pattern
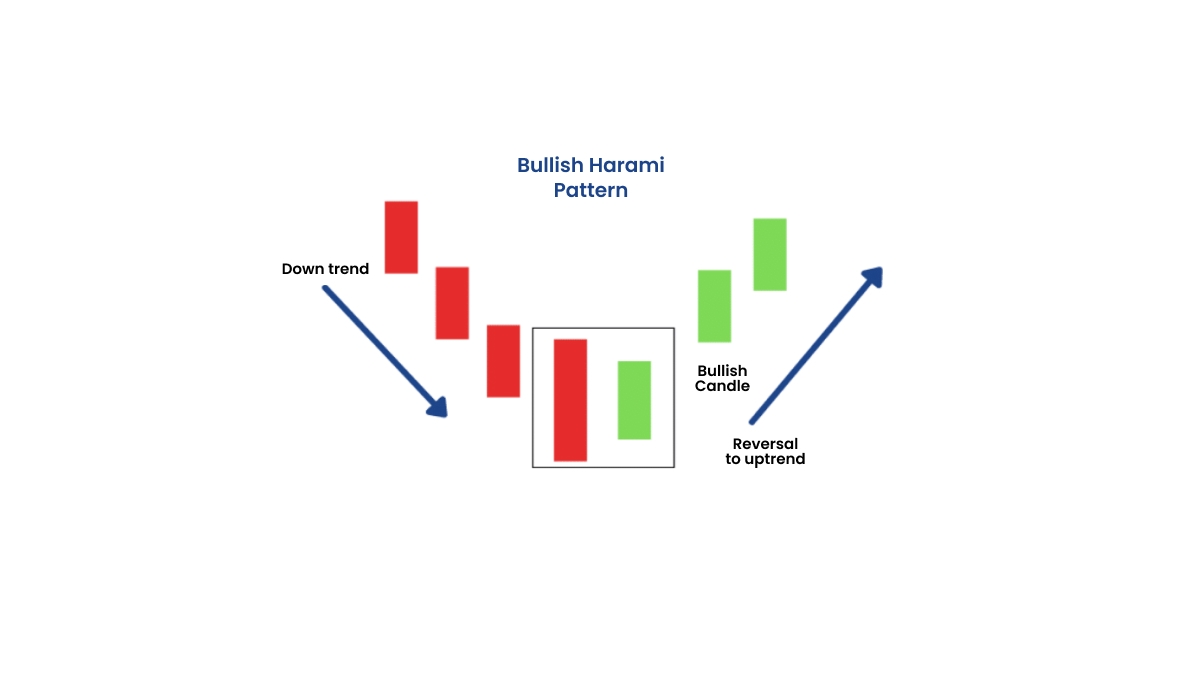
Here’s a step-by-step guide to spot a bullish harami pattern in a candlestick chart:
-
Identify a significant downtrend in the chart.
-
Look for a large bearish candle that continues the downtrend.
-
Check if the second candle is bullish and if it fits inside the first one.
-
Confirm the new trend by checking if the third and fourth candlesticks are also bullish, starting an effective uptrend in the chart.
-
Use other indicators and complementary information to back up the possibility of the new trend.
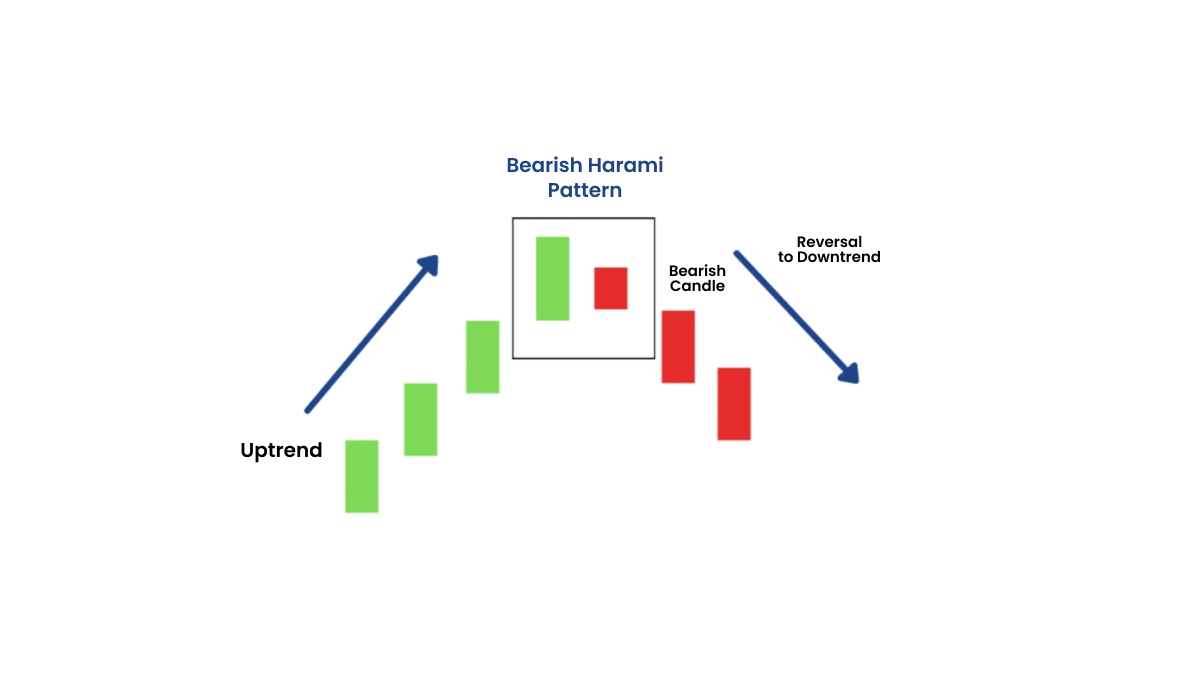
The logic is the same when it comes to recognizing a bearish harami pattern in a candlestick chart, but reversed:
-
Identify a significant uptrend in the chart.
-
Look for a large bullish candle that finishes the uptrend.
-
Check if the second candle is bearish and if it fits inside the first one.
-
Confirm the new trend by checking if the third and fourth candlesticks are also bearish, starting an effective downtrend in the chart.
-
And similarly, do your research with other indicators and more information to validate the possibility of the new trend.
In summary, both bullish and bearish harami patterns are fairly easy to spot in the charts; the challenge is understanding the context of the pattern and if there’s a good chance that their predictions are right.
Trading strategies using harami patterns
Based on the patterns, traders can decide the best moment to buy or sell the asset, ensuring they enter or exit the market at the best possible time.
When it comes to bullish patterns, the best time to start a long position is usually by the third or fourth candle when the pattern is confirmed. A good sign to enter is when the price breaks above the high of the second candle.
Similarly, it’s important to wait for confirmation with bearish harami by the third or fourth candle. A good moment to start your short position is when the price breaks just below the low point of the second candle.
Stop-losses can also be an important tool for minimizing your chance of risk and controlling the amount of money you’re comfortable losing.
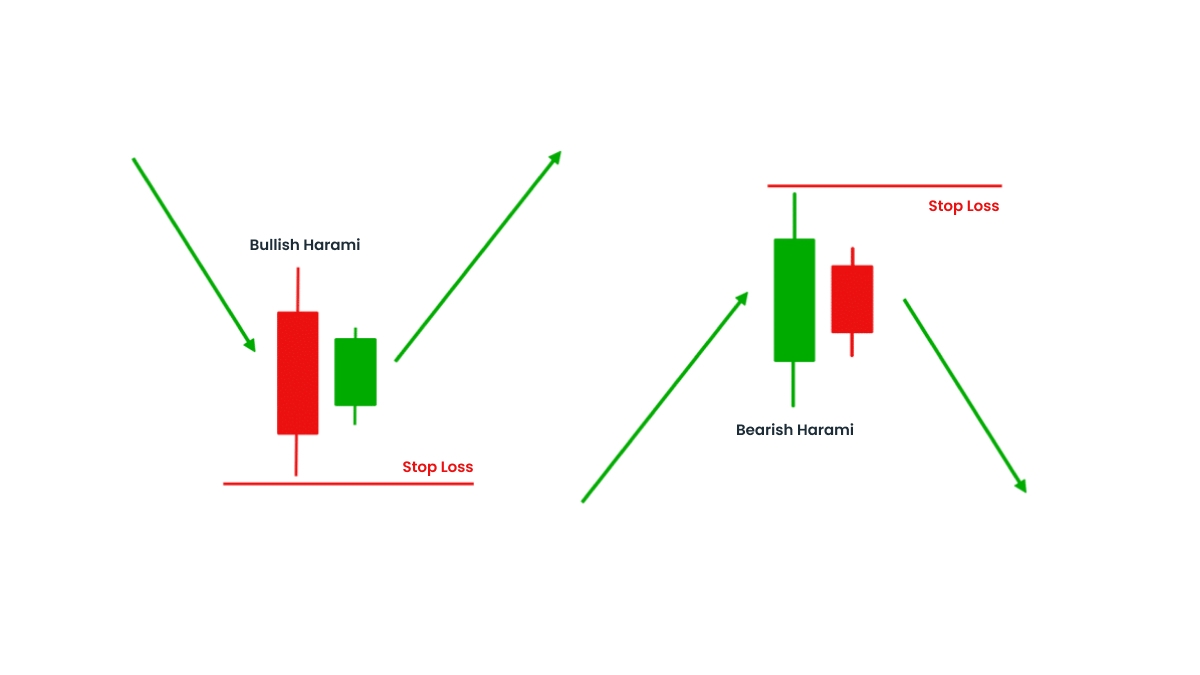
When it comes to a bullish harami, it’s good practice to set a stop-loss below the low of the first bearish red candle. And for a bearish harami, you can set a stop-loss just above the high of the first large bullish candle. Check out the image below to visualize this better:
You can also make sure you set take-profits exploring the historical resistance or support levels of the asset. Don’t let greed run away with you. Keep in mind what gains could be enough for you in this particular market.
Combining harami patterns with other indicators
While it’s true that harami patterns are powerful signs that a reversal is about to happen in the market, they are not fool-proof and should always be used in conjunction with other indicators and metrics.
Key market levels like support or resistance levels are crucial to make sure that the pattern is a strong indication of a change.
For instance, if a bullish harami appears next to a support level, it’s more reliable that the price will actually go higher like the pattern predicts. In a similar manner, if a bearish harami appears near a resistance zone, it might be a strong clue that the price has reached its limit and will indeed start falling according to the pattern.
Other important indications are moving averages, RSI (relative strength index), and Fibonacci retracements.
In short, the more information you get about the asset and market in question, the better you will be able to confidently use harami patterns in your trading strategies.
Pros and cons of using bullish and bearish harami patterns
As with pretty much anything in the finance world, harami patterns have both their benefits and their drawbacks.
Some of the advantages of harami patterns are:
-
Beginner-friendly: they are easy to spot and understand, making them a good tool for beginners.
-
Versatility: they can be used with many different assets and markets.
-
Predictability power: if you use them with complementary information, they can be a powerful way to get ahead in price trends.
And here are some of the disadvantages:
-
No guarantee: the patterns need confirmation and even then they are not 100% reliable.
-
Research needed: they need to be used with other indicators and it’s important to research the market directions.
-
False positives: they can show false positives even if you have other information that goes along with them.
Always double-check your predictions and that risk management actions can give you more control and peace of mind while trading with harami patterns and other prediction tools.
Summary
Harami candlestick patterns are a powerful tool in predicting market changes. The bullish and bearish patterns can help traders get ahead in seeing market reversals and preparing their strategies in a timely manner.
While they are fairly common and easy to understand, even for beginners, it’s crucial to combine them with other market indicators and metrics to make sure you are using the patterns in an informed and safe way.
A final tip is to start training your trader eyes at seeing harami patterns in a demo account before trying them in live markets. By doing that, you will get more confidence in applying what you learned here in your strategies and will reduce the chances of falling prey to a false positive.
Open your demo account with FBS today and start trading with security, flexibility, and reliable trading tools.
