
.jpg)
A fractal is a pattern that can be subdivided into patterns similar to each other as well as to the parent pattern.
Just like it’s Fibonacci ratios are found in nature, fractals also occur often – in plants, crystals, snowflakes, etc.
The idea of fractals was applied to financial markets by Bill Williams. According to him, complex moves of the market are made of self-similar recurring patterns. That means, although the dynamics of a price may seem random, they’re not — they have a specific structure.
Fractal trading
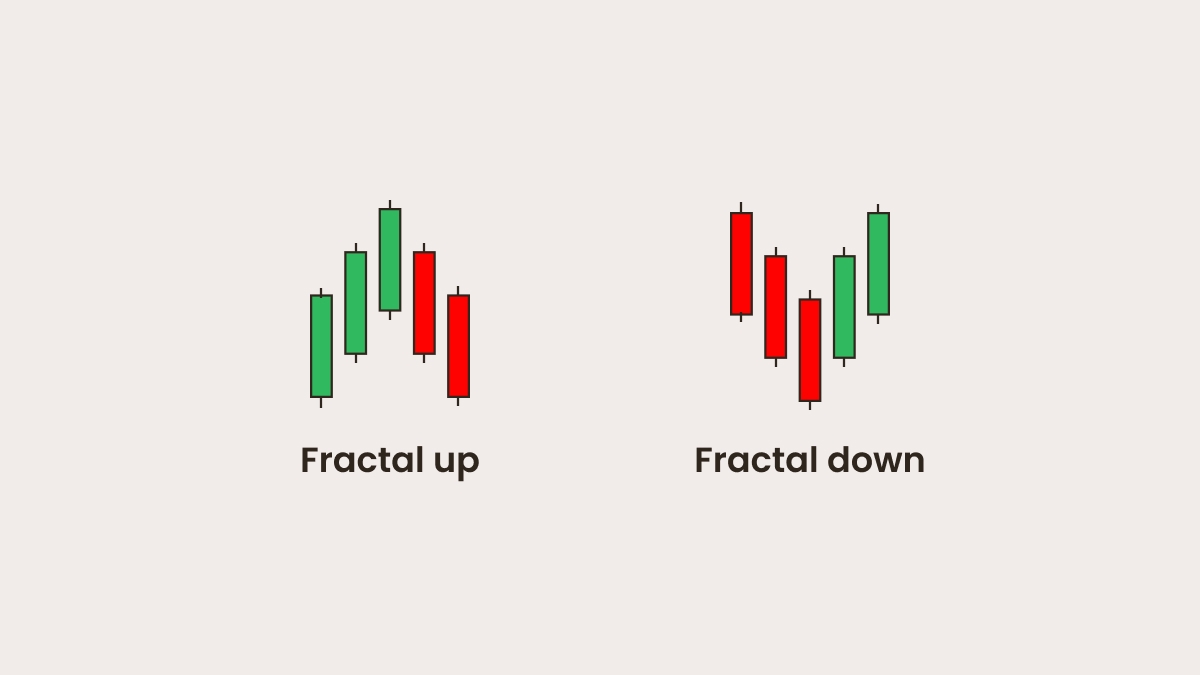
So if we get to the charts, a fractal is considered a pattern formed by at least 5 candlesticks in a way that the high/low of the central candlestick exceeds the extremes of the neighboring candles.
A fractal up is a series of five consecutive candlesticks (bars) where the highest high is preceded by two lower highs and is followed by two lower highs. The opposite configuration would be a fractal down. Both structures look like small reversals of the price. Both fractals (buy and sell) may share candlesticks.
It is not an easy task to constantly track fractals visually. You can have fractals marked on your MetaTrader chart by clicking Insert, choosing Indicators, Bill Williams, and then Fractals. The indicator will add a sign at the middle bar of every fractal it recognizes.
How to trade using fractals
After you add the fractals indicator to a chart, you can hunt for trade signals.
Here’s the method proposed by Bill Williams:
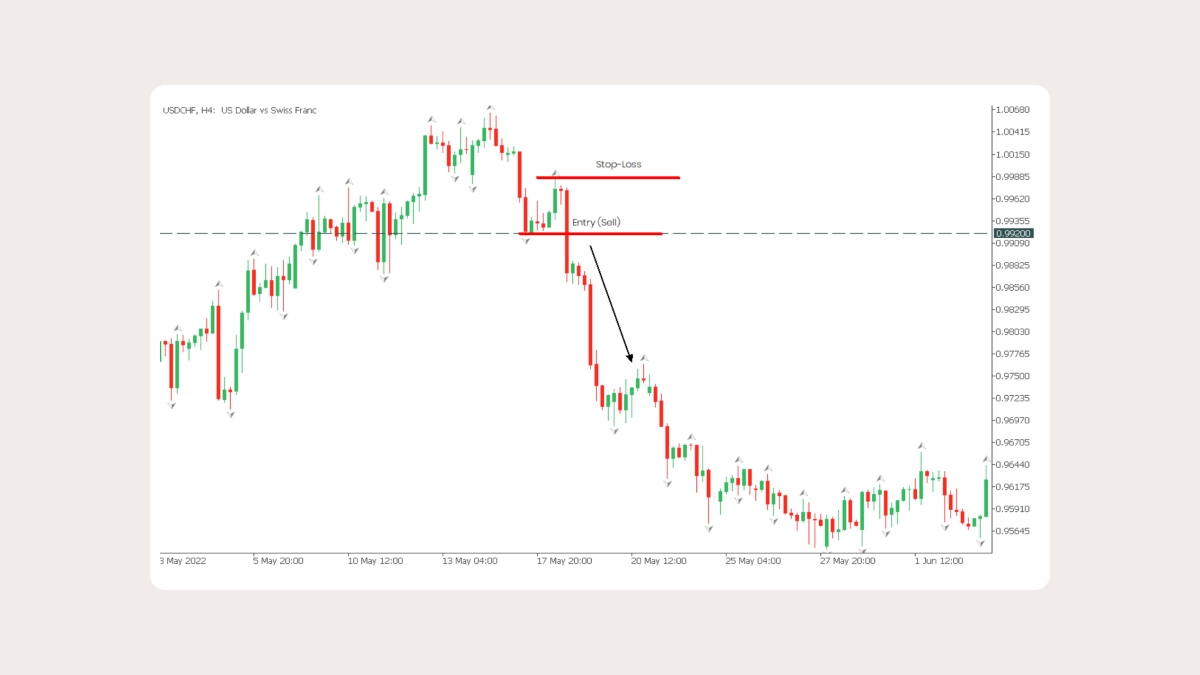
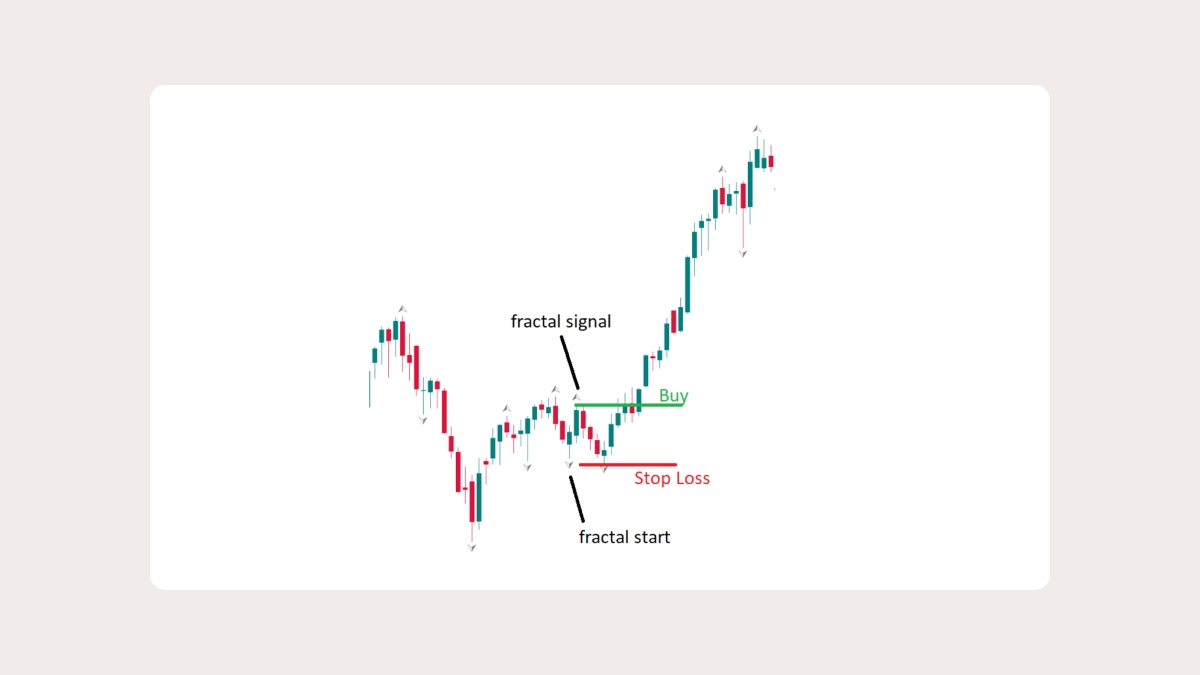
Wait for a scenario where the latest fractal is pointing in the opposite direction from the previous one. This is called a “fractal start”. The trade should be in the direction of the second fractal.
A trading signal will appear if the price goes beyond this fractal (i.e. its middle candlestick).
Put a stop-loss beyond a fractal stop, which is the furthest point from either of the previous two fractals in the opposite direction to the signal.
Summary
The fractals indicator can produce a lot of signals. It’s wise to use it in tandem with other technical indicators developed by Williams (the accelerator/decelerator oscillator, Alligator, the Awesome oscillator, the Gator oscillator, and the market facilitation index) in order to filter the good signals from the bad ones. You can find these indicators in MetaTrader.