Why is Ethereum (ETH) rising?
Ethereum (ETH) has shown a strong recovery in recent days, rising from 1765—March's support level (similar to October 2023 levels)—to 1927 in just two days. These are the key factors behind this movement:
1.- New Privacy Tool: Privacy Pools
How it works:
- Allows more private transactions by grouping legitimate operations.
- If illicit funds are detected, only that specific transaction is blocked without affecting others.
- Includes a mechanism to return legitimate funds if mistakenly flagged.
This innovation has increased confidence in the Ethereum network, attracting more users and investors.
2.- Lower Exchange Supply
The amount of ETH available on exchanges has reached a historic low (18.3 million ETH). This means there is less ETH for sale, which could create upward pressure on the price when demand increases.
3.- Technical Recovery
Following the initial drop triggered by the U.S. economic report (PCE), investors saw the $1,800 level as a key opportunity, driving the price rebound.
Summary:
- The new Privacy Pools technology enhances Ethereum's utility.
- ETH scarcity on exchanges reduces selling pressure.
- Investors are taking advantage of lower prices to accumulate.
These combined factors are driving ETH’s short-term recovery.
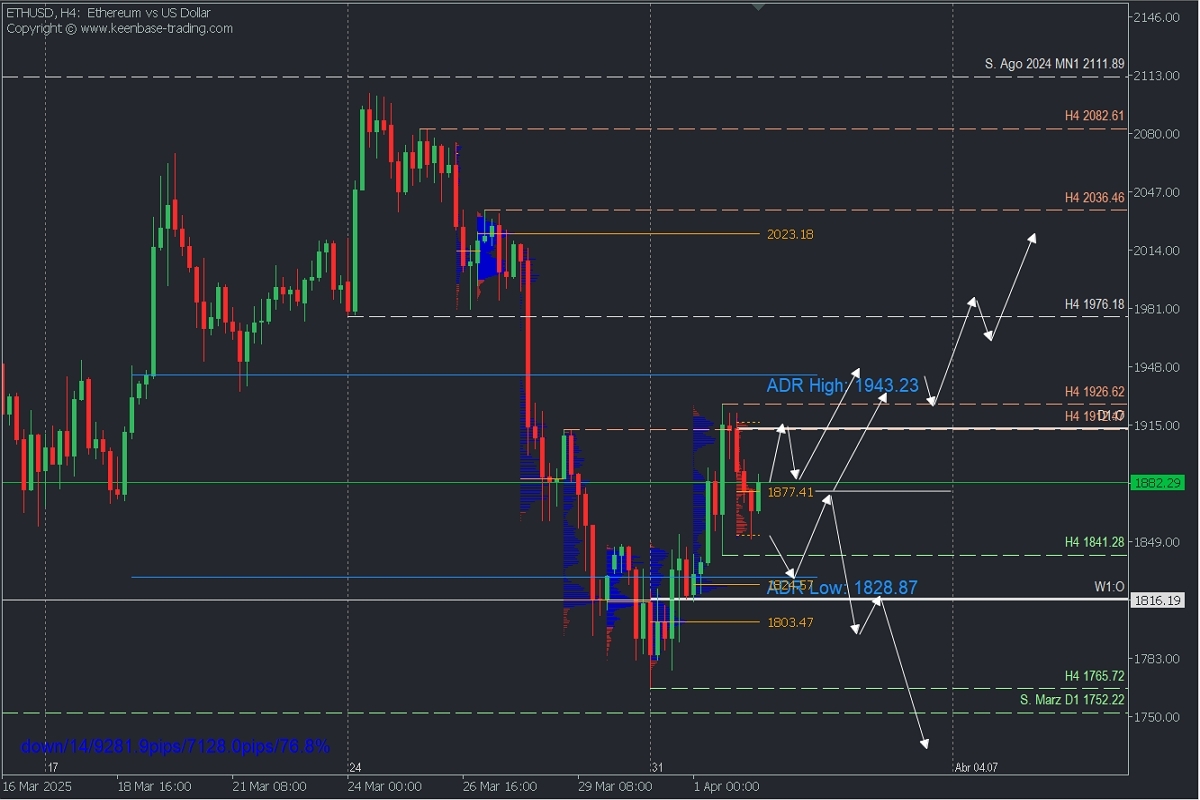
Technical Analysis | ETHUSD, H4

- Supply Zones (Sell): 1976 // 2023.18
- Demand Zones (Buy): 1824.57 // 1803.47
This week’s recovery is testing the last validated H4 resistance at 1912.47, which aligns with the daily open (D:1O). The bounce has shown an adequate pullback without breaking the last key intraday bullish correction support at 1841.28.
This rally shows bullish strength, and there is currently a Point of Control (POC) from early sessions around 1877.41. If the price moves above this level, it could extend toward the daily bullish range at 1943.23, confirming the intraday bullish reversal.
The next swing targets for this anticipated rally aim to fill the volume inefficiency (gap) between 1943 and 1977, with an uncovered POC (supply zone) around 2023.18.
This bullish scenario could be invalidated if the price confirms a breakdown (two lower lows) below the 1841.28 correction support and subsequently breaches the demand zones at 1824.57 and 1803.47, potentially leading to a deeper drop beyond the March support at 1752.22.
Technical Summary:
- Potential Bullish Scenario: If the price moves above 1877, it may test 1912 and 1943 intraday. Continuing above these levels could lead to 1976, 2000, and 2023 targets before facing potential resistance.
- Potential Bearish Scenario: If the price drops below 1841, it may test 1825. A confirmed break below this level could open the door for further movement toward 1805, with additional downside toward 1765 and 1752 if bearish pressure persists.
Uncovered POC:
- POC (Point of Control):
- If a downward move followed, it is considered a selling zone (resistance).
- If an upward move followed, it is considered a buying zone (support).


