Fundamental Analysis
The Nasdaq 100 index has experienced a significant decline in the first quarter of 2025, dropping 10.5%, marking its worst quarterly performance since 2022. This downturn is primarily attributed to uncertainties stemming from President Donald Trump's trade tariffs, which have heightened fears of a global trade war. Large-cap tech stocks, such as Tesla and Nvidia, have suffered substantial losses, with declines of approximately 36% and 20%, respectively. Additionally, the anticipation of new tariffs has led investors to reduce their exposure to the technology sector, contributing to market volatility. In this context, the Nasdaq 100 is trading below its 200-day moving average, a technical analysis indicator that could signal a prolonged bearish trend.
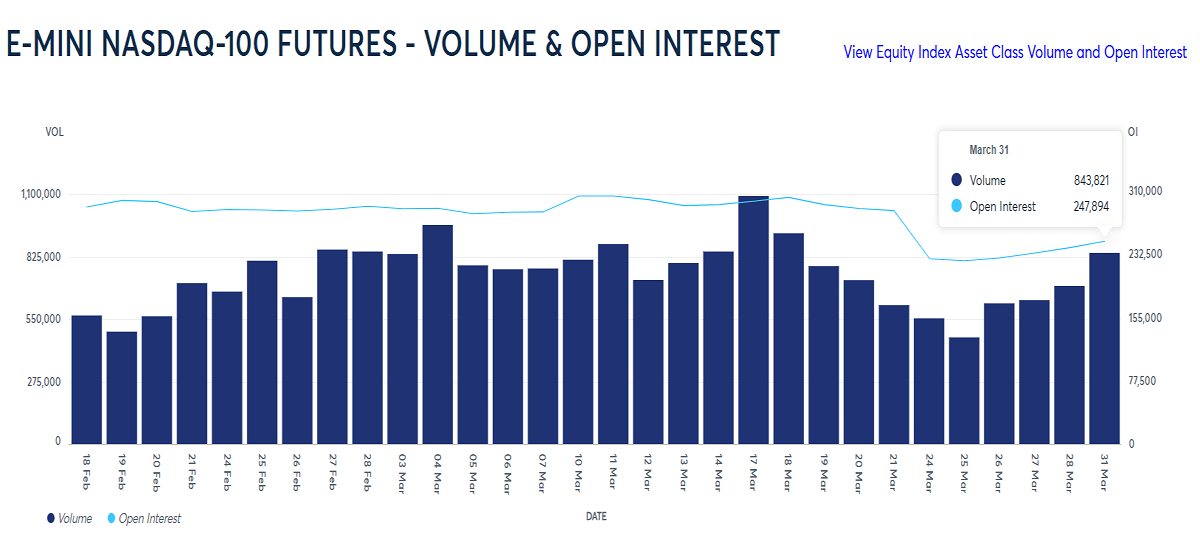
Volume and Open Interest in Nasdaq Futures: The June Nasdaq 100 futures contract has shown increasing volume and rising open interest during the price decline. This pattern suggests a strong bearish trend with potential for continuation in the short term.
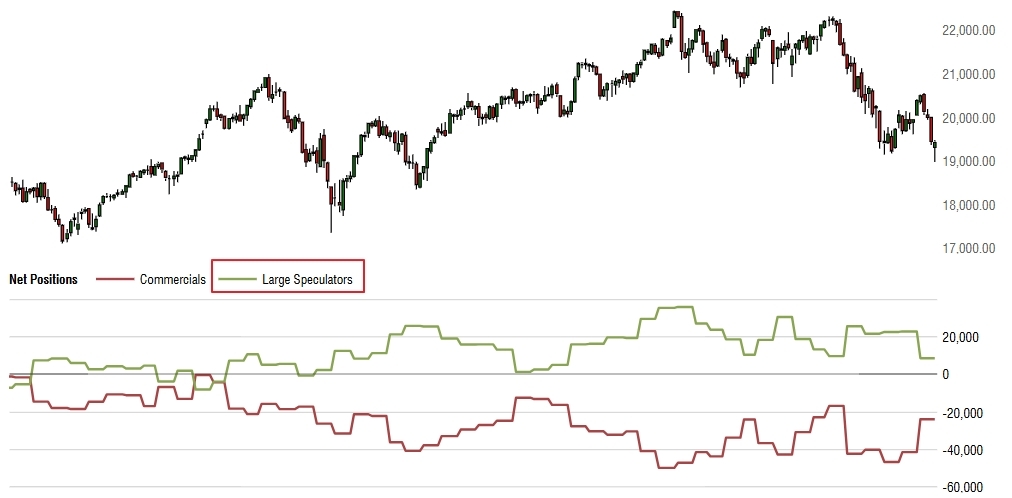
Latest COT Report Insights: The latest Commitments of Traders (COT) report indicates certain stability in the last week, after a substantial reduction in net long positions by institutional investors (large speculators) in March. This implies a lack of confidence in initiating buy positions within the current market environment.
Technical Analysis | US100, H4:
- Supply Zones (Sell): 19663.58 // 19805.77 // 19894.21
- Demand Zone (Buy): 19058.07
The break of the key H4 resistance at 20258.73 on March 26 turned out to be a bull trap or false breakout, followed by a sharp decline on March 27 and 28, decisively breaking the last key H4 support of the upward correction at 19414.89.
The weekly opening left an uncovered Point of Control (POC) at 19058.07, a local demand zone that initiated buying from Monday. As long as the price remains above this level, a broader corrective upward movement is possible, targeting 19415 or 19663, from where selling opportunities may be reconsidered.
If the price decisively breaks through the supply block between 19665 and 19894, a recovery and potential breakout of the 20022.44 resistance in the coming days could be considered. However, the fundamental market scenario does not support optimism for a bullish outlook; rather, it is more likely that the price will prematurely fall below 19058 without extending the correction, than to see a recovery above selling blocks in the current environment.
Technical Summary:
- Bearish Scenario: Sell positions below 19058 with take-profit targets at 18810, 18700, 18500, and 18312 in extension.
- Corrective Bullish Scenario: Buy positions above 19200 with take-profit targets at 19414 or 19663 in extension, from where selling may resume.
Exhaustion/Reversal Pattern (ERP): Before entering any trade in the key zones indicated, always wait for the formation and confirmation of an ERP on the M5 timeframe.
Uncovered POC: Point of Control (POC) refers to the level or zone where the highest concentration of volume occurred. If a downward movement followed from this point, it is considered a selling zone and forms a resistance area. Conversely, if an upward impulse occurred, it is considered a buying zone, usually located at lows, thus forming support areas.


